Fig. 8
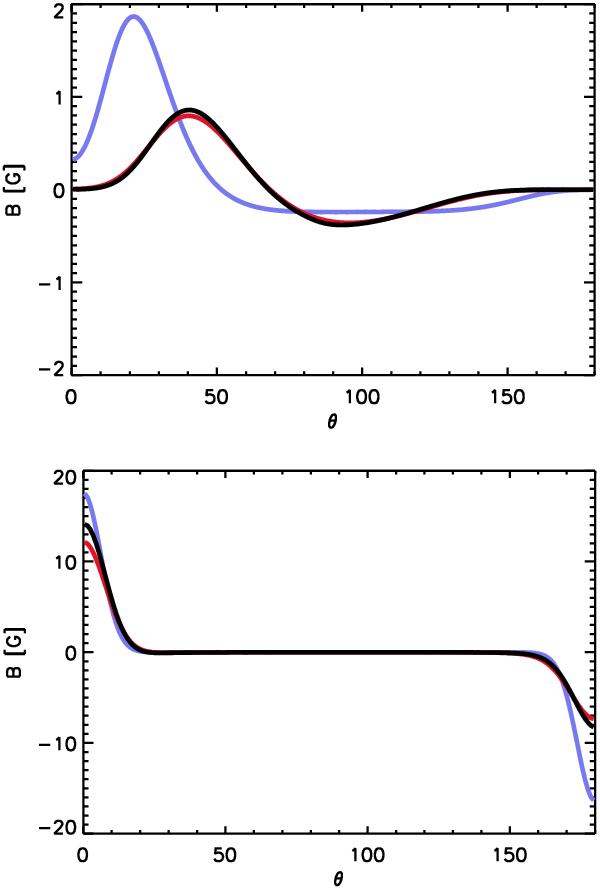
The surface field from FTD simulations at t = 18 months (top) and t = 72 months (bottom) with a vertical field outer boundary using the k = 5 and the meridional velocity profile with p = 0.25, q = 0 and m = 0.5 (black) is used. In this case there is a strong near-surface shear. The results from the SFT model using the surface meridional velocity (blue) and using the average of the meridional velocity above 0.95 R⊙ (red) are shown for comparison.
Current usage metrics show cumulative count of Article Views (full-text article views including HTML views, PDF and ePub downloads, according to the available data) and Abstracts Views on Vision4Press platform.
Data correspond to usage on the plateform after 2015. The current usage metrics is available 48-96 hours after online publication and is updated daily on week days.
Initial download of the metrics may take a while.