Fig. 4
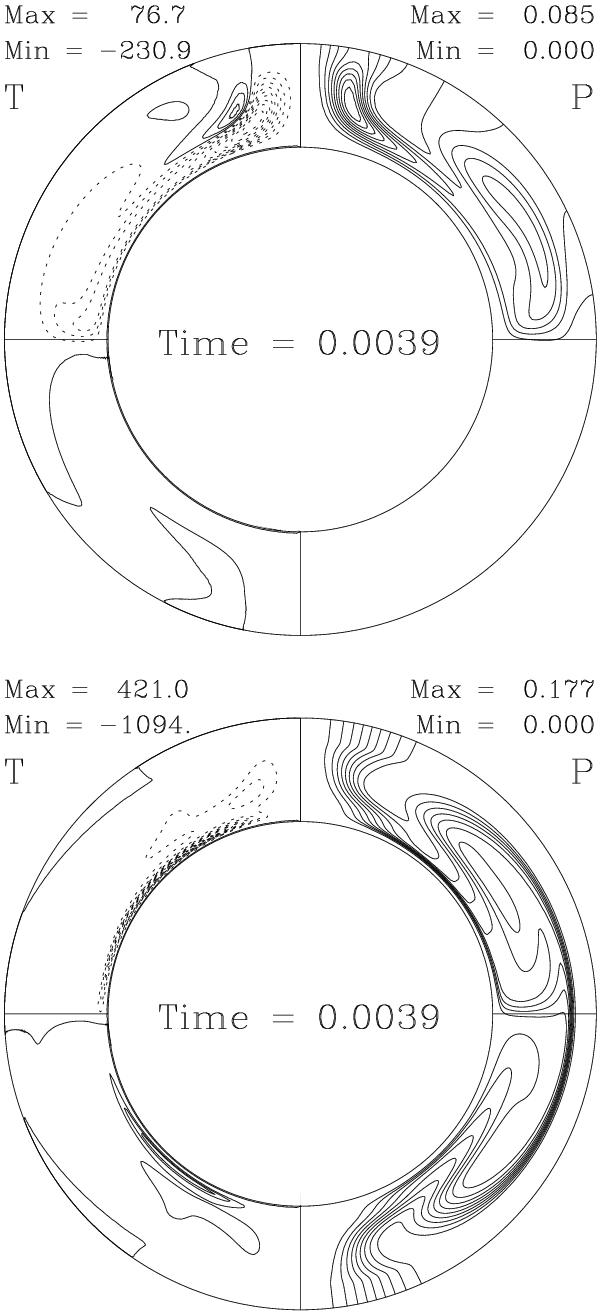
Magnetic field structure from the FTD simulations at t = 72 months for the case with a vertical boundary condition and k = 0 (top) and k = 5 (bottom). In each subpanel the left half shows contours of the toroidal field (T), the right panel shows selected fieldlines of the poloidal field (formally it shows contours of P = rsinθA(r,θ)). The dashed contours of the toroial field indicate negative fields, the solid contours represent either zero or positive toroidal field. In particular the solid contours which touch the boundaries correspond to zero toroidal flux.
Current usage metrics show cumulative count of Article Views (full-text article views including HTML views, PDF and ePub downloads, according to the available data) and Abstracts Views on Vision4Press platform.
Data correspond to usage on the plateform after 2015. The current usage metrics is available 48-96 hours after online publication and is updated daily on week days.
Initial download of the metrics may take a while.