Free Access
Fig. 8
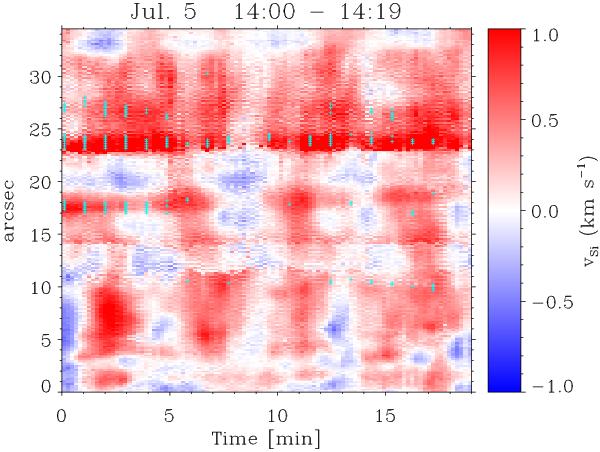
Photospheric velocity time evolution. The time series was taken with the slit fixed on top of the PIL (between x ~ 18″−20″ in the second column of Fig. 2). The velocities were inferred from the “standard” Si i 10 827 Å inversions. The cyan-colored crosses mark the positions of the two-component profiles.
Current usage metrics show cumulative count of Article Views (full-text article views including HTML views, PDF and ePub downloads, according to the available data) and Abstracts Views on Vision4Press platform.
Data correspond to usage on the plateform after 2015. The current usage metrics is available 48-96 hours after online publication and is updated daily on week days.
Initial download of the metrics may take a while.