Fig. 7
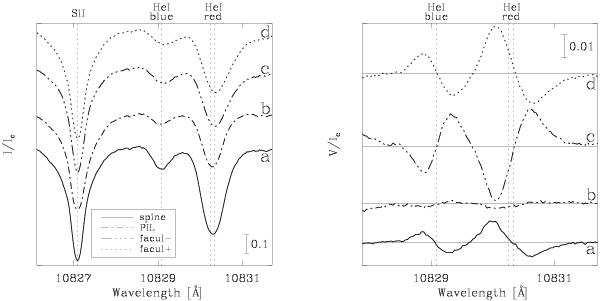
Left: averaged intensity profiles I/Ic of four selected positions of the map acquired on July 5 between 13:39 − 13:58 UT. Each profile is marked with a character a) − d) which indicates its position in Fig. 2. Note the shifted red wing of the blended He i red component for the two facular profiles indicating the presence of more than one component contributing to the line formation. Right: the corresponding helium Stokes V/Ic profiles to the intensity profiles shown on the left panel. The solid lines along the x-axis indicate V/Ic = 0 for each profile. The dotted vertical lines, in both panels, mark the position of the line cores of the involved ions.
Current usage metrics show cumulative count of Article Views (full-text article views including HTML views, PDF and ePub downloads, according to the available data) and Abstracts Views on Vision4Press platform.
Data correspond to usage on the plateform after 2015. The current usage metrics is available 48-96 hours after online publication and is updated daily on week days.
Initial download of the metrics may take a while.