Fig. 6
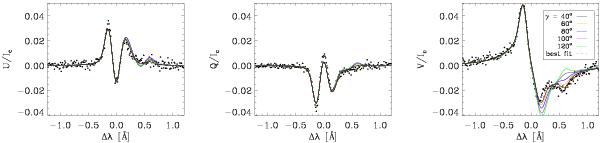
Dots represent the observed Si i Stokes U, Q, and V profiles (same as Fig. 4). The overplotted synthetic profiles were computed using different magnetic field inclination angles for the second component, that varied between γ ∈ [40°, 120°]. The test was performed by varying the magnetic field inclination of the second component and keeping the remaining atmospheric parameters (which came from the best fit of the SIR inversion) fixed. The dotted red line shows the best matching profile, whose corresponding atmospheric parameters are shown in the caption of Fig. 4.
Current usage metrics show cumulative count of Article Views (full-text article views including HTML views, PDF and ePub downloads, according to the available data) and Abstracts Views on Vision4Press platform.
Data correspond to usage on the plateform after 2015. The current usage metrics is available 48-96 hours after online publication and is updated daily on week days.
Initial download of the metrics may take a while.