Fig. 4
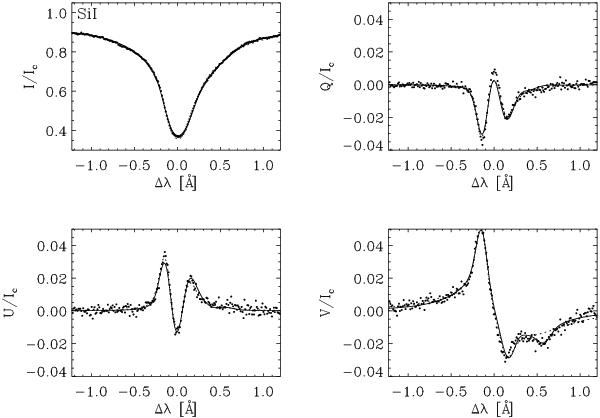
From left to right and top to bottom: Stokes I, Q, U and V profiles (dots) of the Si i line normalized to the continuum, and best fits (solid line) using a two-component SIR inversion. The profiles correspond to [x,y] = [20 1, 194] (area 4 in Fig. 5). The single-component fit (i.e., standard fit) is shown in the dashed lines for comparison and clearly does a worse job at fitting Stokes V. The physical parameters inferred from the two-component inversion are: v1 = 0.3 ± 0.2 km s-1, B1 = 1001 ± 68 G, γ1 = 67° ± 3°, φ1 = 114° ± 2°, f ~ 0.94 for the standard component and v2 = 11 ± 2 km s-1, B2 = 1424 ± 300 G, γ2 = 23° ± 20°, φ2 = 81° ± 51°, f ~ 0.06 for the magnetic one. The inferred stray-light is α ~ 5%. The uncertainties associated to the parameters of the second component were obtained with SIR and verified with the sensitivity analysis explained at the end of Sect. 4.2.
Current usage metrics show cumulative count of Article Views (full-text article views including HTML views, PDF and ePub downloads, according to the available data) and Abstracts Views on Vision4Press platform.
Data correspond to usage on the plateform after 2015. The current usage metrics is available 48-96 hours after online publication and is updated daily on week days.
Initial download of the metrics may take a while.