Fig. 3
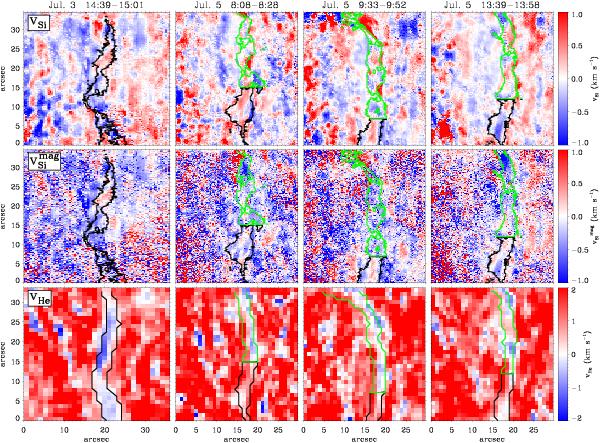
LOS velocities inferred from: the Si i 10 827 Å full Stokes “standard” inversions (top row), the Si i 10 827 Å “magnetic” inversions (with weights: wI = 0, wQ,U = 1.0 and wV = 0.1) (middle row) and He i 10 830 Å inversions (bottom row) at different times. Note that the color scale is saturated at [−1, 1] and [−2, 2] km s-1 for silicon and helium respectively. Pixels inside the contours have magnetic field inclinations, with respect to the LOS, between 75° ≤ γ ≤ 105°. In the July 5 maps, the colored contours distinguish between the orphan penumbrae area (green) and the spine region (black). On July 3, only the spine of the filament was seen. Negative velocities (blue) indicate upflows while positive velocities (red) indicate downflows.
Current usage metrics show cumulative count of Article Views (full-text article views including HTML views, PDF and ePub downloads, according to the available data) and Abstracts Views on Vision4Press platform.
Data correspond to usage on the plateform after 2015. The current usage metrics is available 48-96 hours after online publication and is updated daily on week days.
Initial download of the metrics may take a while.