Fig. 2
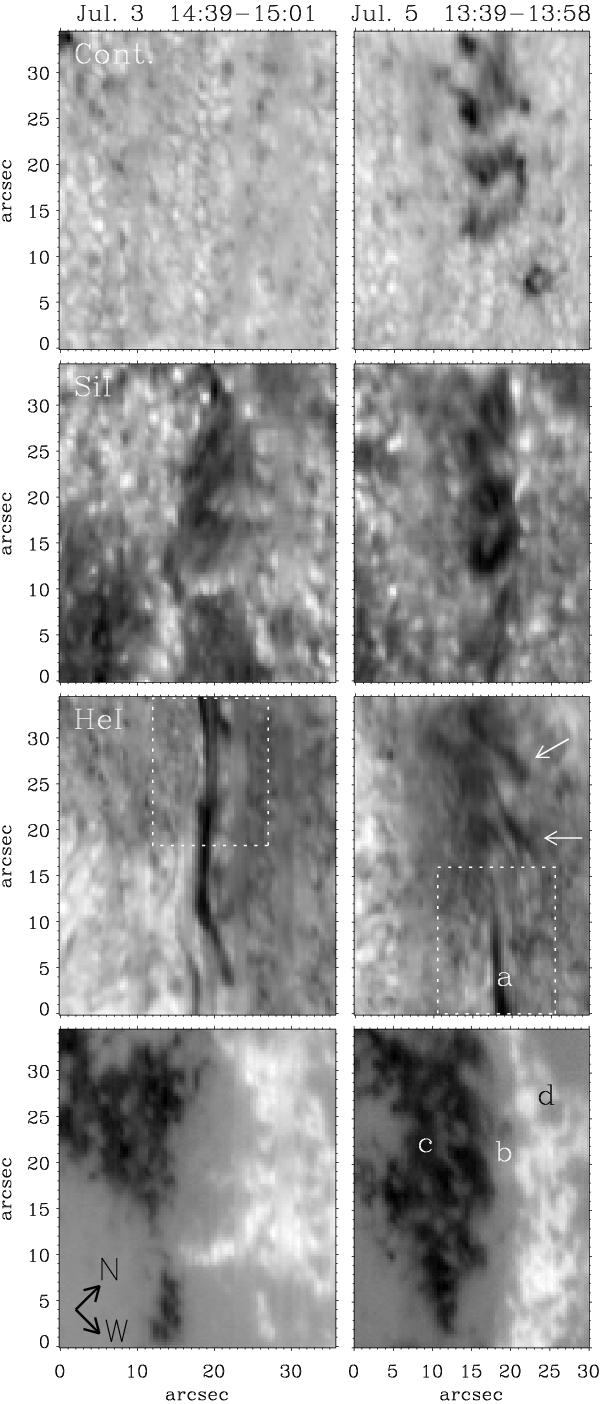
TIP-II slit-reconstructed images for both days of observation. From top to bottom: continuum, Si i line core intensity, He i line core intensity (red component) and Si i Stokes V. The FOV was different on July 3 and July 5. We provide the dashed rectangles to show the approximate common area of the filament on both days. Characters a) − d) indicate the position of the Stokes profiles presented in Fig. 7. The white arrows point to high concentrations of helium with elongated shapes (thread-like structures).
Current usage metrics show cumulative count of Article Views (full-text article views including HTML views, PDF and ePub downloads, according to the available data) and Abstracts Views on Vision4Press platform.
Data correspond to usage on the plateform after 2015. The current usage metrics is available 48-96 hours after online publication and is updated daily on week days.
Initial download of the metrics may take a while.