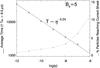
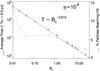
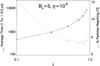
Fig. 13
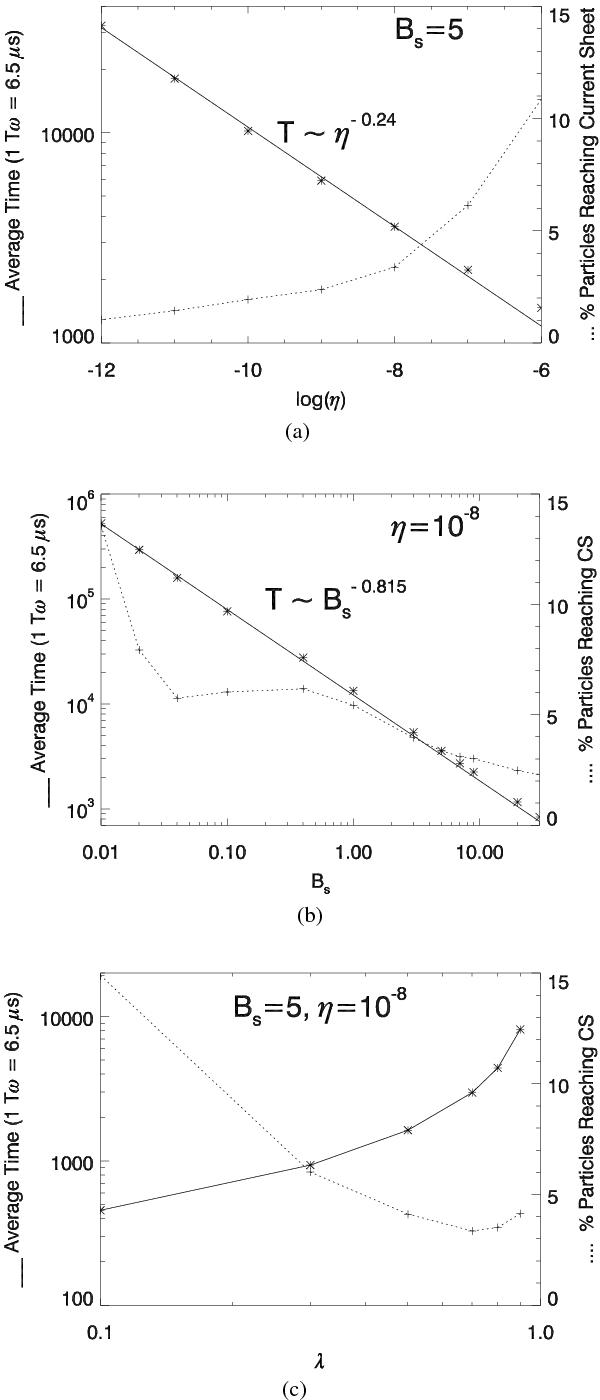
Percentage of total particles (+) reaching current sheet at z = zη from the external region (R = 1 in the inflow quadrant), and the mean time taken (*), for different values of η, Bs and λ. Each data point is from a many particle simulation with initial Maxwellian distribution (T = 86 eV) of 5000 protons. The set-up is the same as that in Fig. 7. a) For different values of η with fixed Bs = α = 5, λ = 0.75. The solid line is a least squares fit to the points. b) For different values of Bs (with Bs = α) for fixed η = 10-8, λ = 0.75. The solid line is a least squares fit. c) For different λ with fixed Bs = α = 5, η = 10-8. No curve was fit.
Current usage metrics show cumulative count of Article Views (full-text article views including HTML views, PDF and ePub downloads, according to the available data) and Abstracts Views on Vision4Press platform.
Data correspond to usage on the plateform after 2015. The current usage metrics is available 48-96 hours after online publication and is updated daily on week days.
Initial download of the metrics may take a while.