Fig. 9
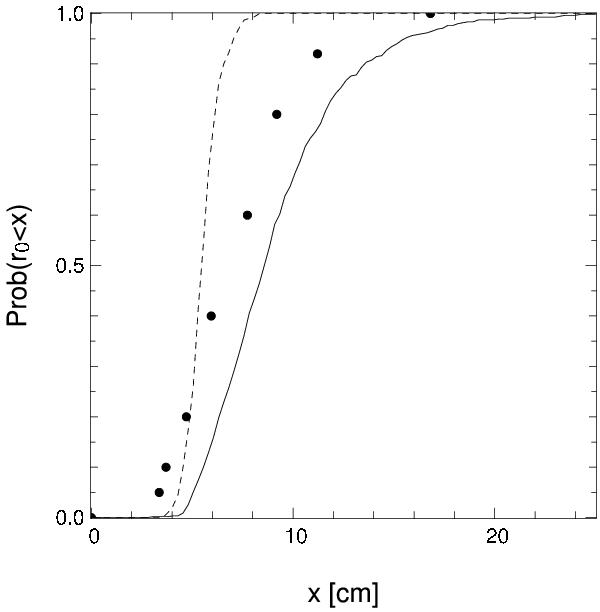
Cumulative distributions of the Fried parameter, r0: the straight line is obtained from the 550 summer values (June–Sept. 2011), the dashed line corresponds to the 311 winter measurements (Jan.–Feb. 2012). The circles represent the values obtained by the ATST survey (Socas-Navarro et al. 2005). All values refer to 0.55 μm wavelength.
Current usage metrics show cumulative count of Article Views (full-text article views including HTML views, PDF and ePub downloads, according to the available data) and Abstracts Views on Vision4Press platform.
Data correspond to usage on the plateform after 2015. The current usage metrics is available 48-96 hours after online publication and is updated daily on week days.
Initial download of the metrics may take a while.