Fig. 22
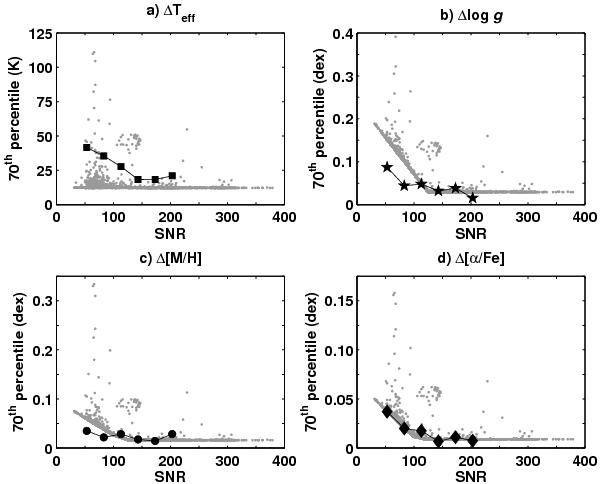
Change in θ with SNR (in bins of 20) for the repeat observations within TGMA (black symbols) compared with the σ(θ)int values (Sect. 5) for TGMA (grey points). a) The ΔTeff that 70% of the repeat sample were less than or equal to at each SNR (black squares). The trend with SNR is shown by the black lines. b) As for a) but for variations in log g (black stars). c) As for a) but for variations in [M/H] (black circles). d) As for a) but for variations in [α/Fe] (black diamonds).
Current usage metrics show cumulative count of Article Views (full-text article views including HTML views, PDF and ePub downloads, according to the available data) and Abstracts Views on Vision4Press platform.
Data correspond to usage on the plateform after 2015. The current usage metrics is available 48-96 hours after online publication and is updated daily on week days.
Initial download of the metrics may take a while.