Free Access
Fig. 16
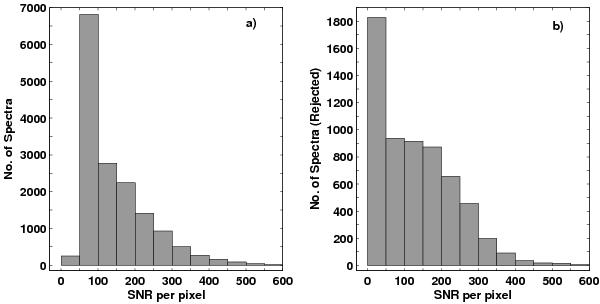
Histogram of the measured SNR values of the FEROS archived spectra in bins of ΔSNR = 50: a) spectra defined as good quality and with well-defined CCFs (N = 15 513); b) spectra rejected as poor quality and/or poorly defined CCFS (N = 6038). The y-axes are to different scale to better display each sample.
Current usage metrics show cumulative count of Article Views (full-text article views including HTML views, PDF and ePub downloads, according to the available data) and Abstracts Views on Vision4Press platform.
Data correspond to usage on the plateform after 2015. The current usage metrics is available 48-96 hours after online publication and is updated daily on week days.
Initial download of the metrics may take a while.