Fig. 12
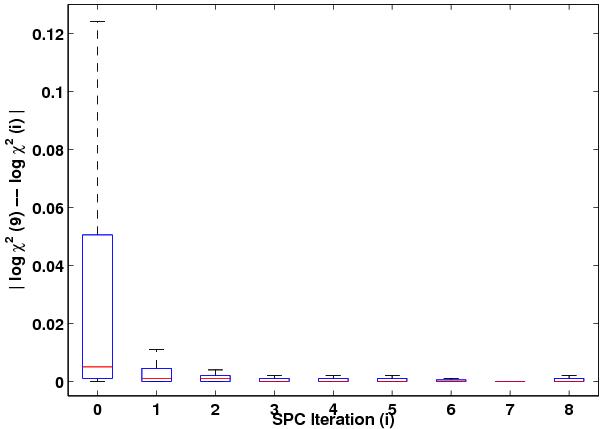
Box & Whisker graph of the absolute difference in the log χ2 of the reconstructed to the normalised spectra for the 384 test spectra between the 9th SPC iteration and each of the previous iterations ( | log χ2(9) − log χ2(i) | ). The box is constrained by the 25th and 75th percentiles, and the red lines are the medians. The whiskers extend to the furthest data points not considered to be outliers.
Current usage metrics show cumulative count of Article Views (full-text article views including HTML views, PDF and ePub downloads, according to the available data) and Abstracts Views on Vision4Press platform.
Data correspond to usage on the plateform after 2015. The current usage metrics is available 48-96 hours after online publication and is updated daily on week days.
Initial download of the metrics may take a while.