Fig. 1
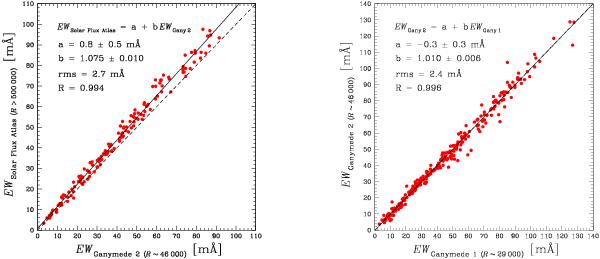
Left panel: comparison of the EWs measured in this work in the Ganymede spectrum (second observation run) by Gaussian function fit to those measured by Meylan et al. (1993) in the Solar Flux Atlas by Voigt function fit; filled circles represent 145 lines of several elements; the linear regression (solid line) is the same expressed by Eq. (2). Right panel: comparison of the EWs listed in Table 8 of all lines in the Ganymede spectra in common to both runs after the conversions according to Eqs. (1) and (2); the coefficients of the linear regression (solid line) are shown.
Current usage metrics show cumulative count of Article Views (full-text article views including HTML views, PDF and ePub downloads, according to the available data) and Abstracts Views on Vision4Press platform.
Data correspond to usage on the plateform after 2015. The current usage metrics is available 48-96 hours after online publication and is updated daily on week days.
Initial download of the metrics may take a while.