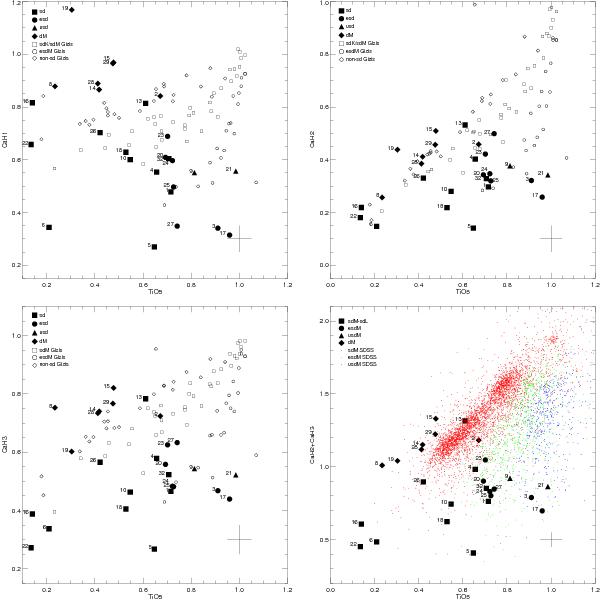
Fig. 7

Top left: CaH1 vs. TiO5 indices for our new ultracool subdwarfs. Top right: CaH2 vs. TiO5 indices. Bottom left: CaH3 vs. TiO5 indices. Bottom right: sum of CaH2 and CaH3 vs. TiO5 indices. Subdwarfs, extreme subdwarfs, ultra-subdwarfs, old solar-metallicity M dwarfs from our sample are marked as filled squares, circles, triangles, and diamonds, respectively. Numbers denominating our new discoveries follow the order by right ascension from Table 4. Open symbols are known subdwarfs discussed in Gizis (1997). The small coloured dots in the bottom right plot represent sources with SDSS spectroscopy classified as subdwarfs (red), extreme subdwarfs (green), and ultra-subdwarfs (blue). For the subdwarfs with two spectra from FORS2 and SDSS, we plotted only the indices derived from the VLT FORS2 spectra. Typical uncertainties on the spectral indices are about of 0.1 (cross at the bottom of each plot). These plots follow the standard figures presented in Fig. 1 of Gizis (1997) and Fig. 3 of Lépine et al. (2007).
Current usage metrics show cumulative count of Article Views (full-text article views including HTML views, PDF and ePub downloads, according to the available data) and Abstracts Views on Vision4Press platform.
Data correspond to usage on the plateform after 2015. The current usage metrics is available 48-96 hours after online publication and is updated daily on week days.
Initial download of the metrics may take a while.


