| Issue |
A&A
Volume 542, June 2012
|
|
|---|---|---|
| Article Number | A19 | |
| Number of page(s) | 8 | |
| Section | Extragalactic astronomy | |
| DOI | https://doi.org/10.1051/0004-6361/201118713 | |
| Published online | 28 May 2012 | |
Deep observation of the giant radio lobes of Centaurus A with the Fermi Large Area Telescope
1 Max-Planck-Institut für Kernphysik, PO Box 103980, 69029 Heidelberg, Germany
e-mail: This email address is being protected from spambots. You need JavaScript enabled to view it.
2 Key Laboratory of Dark Matter and Space Astronomy, Purple Mountain Observatory, Chinese Academy of Sciences, 210008 Nanjing, PR China
3 University of Rome Sapienza and ICRANet, Dip. Fisica, p.le A. Moro 2, 00185 Rome, Italy
4 Institute for Physical Research, NAS of Armenia, 0203 Ashtarak-2, Armenia
5 Dublin Institute for Advanced Studies, 31 Fitzwilliam Place, Dublin 2, Ireland
Received: 22 December 2011
Accepted: 24 March 2012
Abstract
The detection of high-energy (HE) γ-ray emission up to ~3 GeV from the giant lobes of the radio galaxy Centaurus A has been recently reported by the Fermi-LAT Collaboration based on ten months of all-sky survey observations. A data set more than three times larger is used here to study the morphology and photon spectrum of the lobes with higher statistics. The larger data set results in the detection of HE γ-ray emission (up to ~6 GeV) from the lobes with a significance of more than 10 and 20σ for the north and the south lobe, respectively. Based on a detailed spatial analysis and comparison with the associated radio lobes, we report evidence for a substantial extension of the HE γ-ray emission beyond the WMAP radio image for the northern lobe of Cen A. We reconstructed the spectral energy distribution (SED) of the lobes using radio (WMAP) and Fermi-LAT data from the same integration region. The implications are discussed in the context of hadronic and time-dependent leptonic scenarios.
Key words: gamma rays: galaxies / radiation mechanisms: non-thermal / galaxies: active
© ESO, 2012
1. Introduction
The bright, nearby radio galaxy Centaurus A (Cen A; NGC 5128) has been extensively studied from radio to very-high-energy (VHE) γ-rays (e.g., see Israel 1998; Steinle 2010, for reviews). Its unique proximity (d ~ 3.7 Mpc; Ferrarese et al. 2007) and peculiar morphology allow a detailed investigation of the non-thermal acceleration and radiation processes occurring in its active nucleus and its relativistic outflows. At radio frequencies Cen A reveals giant structures, the so-called “lobes”, with a total angular size of ~10° (Shain 1958; Burns et al. 1983), corresponding to a physical extension of ~600 kpc (d/3.7 Mpc).
At high-energy (HE; 200 MeV < E < 100 GeV) Fermi-LAT has recently detected γ-ray emission from the core (i.e., within ~0.1°) and the giant radio lobes of Cen A (Abdo et al. 2010a,b): an analysis of the available ten-month data set reveals a point-like emission region coincident with the position of the radio core of Cen A, and two large extended emission regions detected with a significance of 5 and 8σ for the northern and the southern lobe, respectively. The HE emission from the core extends up to ~10 GeV and is well described by a power-law function with photon index ~2.7. It can be successfully interpreted as originating from synchrotron self-Compton (SSC) processes in the innermost part of the relativistic jet. However, a simple extrapolation of the HE core spectrum to the TeV regime tends to under-predict the TeV flux observed by HESS (Aharonian et al. 2009), which may indicate an additional contribution related to, e.g. non-thermal magnetospheric processes emerging at the highest energies (see Rieger 2011, for review). The extended HE emission regions, on the other hand, seem to be morphologically correlated with the giant radio lobes and contribute more than one-half to the total HE source emission. These regions are again spectrally well described by a power-law function extending up to 2 or 3 GeV with photon indices of Γ ~ 2.6.
If the extended HE emission is generated by indeed inverse-Compton up-scattering of cosmic microwave background (CMB) and extragalactic background light (EBL) photons, this could offer a unique possibility to spatially map the underlying relativistic electron distribution in this source. The detection of GeV γ-rays from the radio lobes implies magnetic field strengths ≲ 1 μG (e.g., Abdo et al. 2010a). This estimate can be obtained quite straightforwardly from the comparison of radio and γ-rays, assuming that these radiation components are produced in the same region by the same population of electrons through synchrotron and inverse-Compton processes. In general, however, the radio and the γ-ray region do not need to coincide. While the radio luminosity depends on the product of the relativistic electron density Ne and the magnetic-field square B2, the inverse-Compton γ-ray luminosity only depends on Ne. This implies that γ-rays can give us model-independent information about both the energy and the spatial distribution of electrons, while the radio image of synchrotron radiation strongly depends on the magnetic field. As a consequence, the γ-ray image can be larger than the radio image if the magnetic field drops at the periphery of the region occupied by electrons. This provides one of the motivations for a deeper study of the extended HE (lobe) emission region in Cen A. In principle, X-ray observations could also offer valueable insights into the electron (albeit in a different energy band) and the magnetic field distributions in the lobes (e.g., Hardcastle & Croston 2005). Gamma-ray observations, however, bear a certain advantage in that the characteristic cooling timescales for electrons that upscatter CMB photons into the GeV domain is much shorter (tc ~ 106[106/γ] yr), thereby enabling one to trace local conditions much more closely. Since the TeV electrons responsible for GeV γ-rays cannot move much beyond ( ≲ 1 kpc) their acceleration points, the very fact of the existence of extended γ-ray lobes in Cen A implies that we deal with a huge (distributed) 200 kpc-size TeV electron accelerator. Moreover, for a hard uncooled spectrum of low-energy electrons, the inverse Compton emission in the X-ray band will be suppressed. Therefore, an X-ray detection of the very extended lobes is complicated (cf. Isobe et al. 2001).
In the present paper we analyze 3 yr of Fermi-LAT data, increasing the available observation time by more than a factor of three with respect to the previously reported results. The larger data set allows a detailed investigation of the spectrum and morphology of the lobes with better statistics, especially above 1 GeV, where the spectral shape may reflect cooling effects and/or maximum energy constraints on the parent population of particles generating the HE γ-ray emission. We also re-analyze radio data from WMAP (Page et al. 2003) for the same region from where the HE emission is evaluated from, and discuss the implications of the resulting spectral energy distribution (SED) for different emission scenarios.
The paper is structured as follows. In Sect. 2 the spectral and spatial HE analysis results are described, while the analysis of the WMAP results for the lobes is presented in Sect. 3. Implications for leptonic and hadronic emission models are discussed in Sect. 4 and conclusions are presented in Sect. 5.
2. Fermi-LAT data analysis
The Large Area Telescope (LAT) on board the Fermi γ-Ray Space Telescope, operating since August 4, 2008, can detect γ − ray photons with energies in the range between 100 MeV and a few 100 GeV. Details about the LAT instrument can be found in Atwood et al. (2009). Here we analyze the field of view (FoV) of Cen A, which includes the bright core and the giant radio lobes. We selected data obtained from the beginning of the operation until November 14, 2011, amounting to ~3 yr of data (MET 239557417– 342956687). We used the standard LAT analysis software (v9r23p1)1. To avoid systematic errors due to poor determination of the effective area at low energies, we selected only events with energies above 200 MeV. The region-of-interest (ROI) was selected to be a rectangular region of size 14° × 14° centered on the position of Cen A (RA = 201°21′54′′, Dec = −43°1′9′′). To reduce the effect of Earth albedo backgrounds, time intervals when the Earth was appreciably in the FoV (specifically, when the center of the FoV was more than 52° from zenith) as well as time intervals when parts of the ROI were observed at zenith angles > 105° were also excluded from the analysis. The spectral analysis was performed based on the P7v6 version of the post-launch instrument response functions (IRFs). We modeled the Galactic background component using the LAT standard diffuse background model gal_2yearp7v6_v0 and we left the overall normalization and index as free parameters. We also used iso_p7v6source as the isotropic γ-ray background.
The resulting Fermi-LAT counts map for the 3 yr data set is shown in Fig. 1a. The (green) crosses show the position of the point-like sources from the 2FGL catalog (Nolan et al. 2012) within the ROI. The core of Cen A is clearly visible with a test statistic of TS > 800, corresponding to a detection significance of 28σ. Extended emission to the north and south of Cen A is detected with significances of TS > 100 (10σ) and TS > 400 (20σ), respectively.
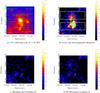 |
Fig. 1 The different maps for the Cen A region: a) LAT counts map of the 14° × 14° region of interest (ROI) around the position of Cen A. The counts map is smoothed with a Gaussian of kernel 0.8°. The green crosses mark the position of the 2FGL point-like sources. b) Excess map after subtraction of diffuse background, point-like sources and Cen A core. The contours are WMAP radio lobe contours, while the white boxes represent the projection regions discussed in Sect. 2.1. c) Residual map using template T1 for the lobes. d) Residual map using the radio template T2 for the lobes. |
2.1. Spatial analysis
Events with energies between 200 MeV and 30 GeV were selected. The residual image after subtracting the diffuse background and point-like sources including the core of Cen A is shown in Fig. 1b. The fluxes and spectral indices of 11 other point-like sources generated from the 2FGL catalog within the ROI are also left as free parameters in the analysis. The 2FGL catalog source positions are shown in Fig. 1a, where 2FGL J1324.0-4330e accounts for the lobes (both north and south). A new point-like source (2FGL J1335.3-4058), located at RA = 203°49′30′′, Dec = −40°34′48′′ accounts for some residual emission from the north lobe, although no known source at other wavelengths is found to be associated. We treat it as part of the north lobe here. The core of Cen A is modeled as a point-like source. Then the following steps were performed:
-
(1)
To evaluate the total (extended) HE γ-ray emission we first used a template based on the residual map (T1; corresponding to the blue contours in Fig. 2). The TS values for the south and the north lobe in this template are 411 and 155, respectively. The residual map was also compared with radio (WMAP, 22 GHz) lobe contours (green contours overlaid in Fig. 1b). While lower-frequency radio maps exist, we expect the higher-frequency 22 GHz map to better represent the GeV-emitting particles. We find that the south lobe of the HE γ-ray image is similar to the south lobe of the radio one, whereas the HE emission in the north extends beyond the radio lobe emission region.
-
(2)
To understand this feature better, we re-fitted the excess using an additional template (T2; red contours in Fig. 3) generated from the radio (WMAP) image. The two templates are shown in Fig. 2, and the corresponding residual maps are shown in Fig. 1. While there is some residual emission to the north of Cen A for template T2, this residual emission is obviously absent from template T1. The qualitative features of the different residual maps are confirmed by the corresponding TS values, which are listed in Table 1. Accordingly, the HE south lobe seems to agree reasonably well with the radio south lobe, whereas for the north lobe, the template generated from the radio lobe (T2) fits the HE excess substantially worse than T1 (110 vs. 155).
-
(3)
To further investigate a possible extension (or contribution of a background source) of the north lobe, we evaluated the projection of a rectangular region on the excess image (in white in Fig. 1b). Figure 3 shows the projection for the north and south regions for Fermi-LAT image (in black) and the radio one (in red). The south projection for the radio map is well-fitted by a single Gaussian centered at ~0.05 (0 is defined as the center of the rectangle on RA = 201°21′54′′, Dec = −43°1′9′′) with an extension of σ = 0.99°. For the Fermi-LAT map the Gaussian is centered at ~0.5 and has σ = 1.01°, compatible with the radio map projection. In contrast, the north projection for the Fermi-LAT map has a Gaussian profile with σ = 1.68°, while for the radio map σ is 0.97°. The extension in the north projections for the Fermi-LAT map indicates that the γ-ray north lobe is more extended than the radio one or that an (otherwise unknown) source in the background may be contributing to the total emission.
TS value for the two templates used.
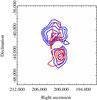 |
Fig. 2 Two templates used in the analysis. The blue contours correspond to T1 and the red to T2. |
2.2. Spectral analysis
Our morphological analysis indicates some incongruity between the morphology of the radio lobe and γ-ray lobe in the north. Hence, to model the γ-ray lobe as self-consistently as possible, we used the template generated with the residual map (T1). Integrating the whole γ-ray emission observed, we then derived the total flux and index in the 100 MeV to 30 GeV energy range. For the north lobe the integral HE flux is (0.93 ± 0.09) × 10-7 ph cm-2 s-1 and the photon index is 2.24 ± 0.08, while for the south lobe we find (1.4 ± 0.2) × 10-7 ph cm-2 s-1 and 2.57 ± 0.07, respectively. The core region of Cen A has a flux (1.4 ± 0.2) × 10-7 ph cm-2 s-1 while the photon index is 2.7 ± 0.1. The results are summarized in Table 2, where the subscripts 3a and 10m refer to the three-year data (analyzed here) and the ten-month data (reported in Abdo et al. 2010a), respectively. We find that the flux and photon indices in the T2 templates are similar to the ten-month data. On the other hand, the analysis using the T1 template results in a harder spectrum for the north lobe.
To derive the SED we divided the energy range into logarithmically spaced bands and applied gtlike in each of these bands. Only the energy bins for which a signal was detected with a significance of at least 2σ wereconsidered, while an upper limit was calculated for those below. As a result, there are seven bins in the SED for the south lobe. The SED is shown in Fig. 4.
Fluxes and spectra of the lobes.
To clarify the origin of the γ-ray emission, we evaluated the spectrum in different parts of each lobe. To this end, we divided each lobe into two parts (see Fig. 5) and used gtlike to evaluate the spectrum. In the south lobe the resulting photon index is 2.8 ± 0.2 near the Cen A core and 2.3 ± 0.1 far away from the core. Unfortunately, the statistics are still not high enough to claim a clear hardening of the spectrum. For the northern lobe, both parts appear to be consistent with values of 2.2 ± 0.2. The spectra for the four regions are shown in Figs. 6 and 7.
3. WMAP data
In Sect. 2 we found evidence that the HE γ-ray emission regions do not coincide well with the radio lobes, especially for the north lobe. To correctly compare the γ-ray emission with the radio emission, an analysis of the radio data for the same region is required, rather than simply for the north radio lobe itself. We performed this analysis following the method described in Hardcastle et al. (2009). Seven years of WMAP data were analyzed (Komatsu et al. 2011). The WMAP maps in all five bands are convolved with a 0.83° Gaussian to obtain a similar resolution for all bands. The internal linear combination (ILC) CMB map was treated as background and subtracted from all maps. The intensity maps (in mK) were converted to flux maps (in Jy/beam) (Page et al. 2003) and integrated in the region defined by the north γ-ray lobe to obtain the total flux. Flux values almost twice as high were obtained when the γ-ray region was used. To cross-check our analysis method, we also derived the flux of the north radio lobe for the same region as used in Hardcastle et al. (2009). All results are summarized in Table 4. Our results for the north radio lobe are compatible within errors with those obtained by Hardcastle et al. (2009) (shown in parenthesis in Table 3). Note that in the V and the W band the signal is detected at less than the 5σ level, so we only give upper limits here.
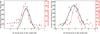 |
Fig. 3 Projection of the rectangular region shown in Fig. 1b for both lobes. The curves are Gaussian fits, with WMAP data in red and Fermi-LAT data in black. Units for the positional (x) axis are degrees. |
Radio flux for the north lobe (in 1011 Jy Hz) from WMAP data.
4. The origin of the non-thermal lobe emission
Using the WMAP and Fermi-LAT results reported here, we can characterize the SEDs for the north and the south lobe. While the radio emission is usually taken to be caused by electron synchrotron emission, the origin of the HE γ-ray emission could in principle be related to both leptonic (inverse-Compton scattering) and hadronic (e.g., pp-interaction) processes. In the following we discuss possible constraints for the underlying radiation mechanism as imposed by the observed SEDs.
4.1. Inverse-Compton origin of γ-rays
Both the HE γ-ray and the radio emission could be accounted for in a leptonic scenario. In the simplest version, a single population of electrons N(γ,t) is used to model the SED through synchrotron and inverse-Compton emission, with particle acceleration being implicitly treated by an effective injection term Q = Q(γ,t). The latter allows us to distinguish acceleration caused by, e.g., multiple shocks or stochastic processes (e.g., O’Sullivan et al. 2009) from emission, and enables a straightforward interpretation. The kinetic equation describing the energetic and temporal evolution of the radiating electrons can then be written as 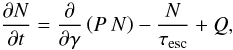 (1)where
  is the (time-independent) energy loss rate and τesc is the characteristic escape time. For negligible escape (as appropriate here, given the large size of the γ-ray emitting region) and quasi continuous injection (considered as a suitable first-order approximation given the short lifetime of TeV electrons and the scales of the lobes) Q(γ,t) = Q(γ), the solution of the kinetic equation becomes
  (2)where γ0 is found by solving the characteristic equation for a given epoch t,
  (e.g., Atoyan & Aharonian 1999). If synchrotron or inverse-Compton (Thomson) losses (P(γ) = aγ2) provide the dominant loss channel, then γ0 = γ/(1 − aγt), so that at the energy
  the stationary power-law electron injection spectrum steepens by a factor of 1 (cooling break) due to radiative losses, naturally generating a broken power-law.
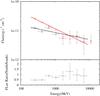 |
Fig. 4 SED for template T1. Squares and crosses are for the north lobe and the south lobe, respectively. The ratio of the fluxes (north/south) are shown in the bottom panel. |
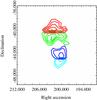 |
Fig. 5 Two lobes divided into two parts (near core of Cen A core and farther away) for spectral comparison. The contours in different colors represent the different parts. |
We used the above particle distribution described in Eq. (2) for a representation of the observed lobe SEDs. The magnetic field strength B, the maximum electron energy γmax and the epoch time t were left as free parameters to model the data. Klein-Nishina (KN) effects on the inverse-Compton-scattered HE spectrum were taken into account (following Aharonian & Atoyan 1981).
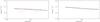 |
Fig. 6 SEDs for the corresponding subregions in the north. The left panel is the SED of the subregion far from the core, while the right panel refers to the subregion near the core. The colors are the same as used in the definition in Fig. 5. |
 |
Fig. 7 Same as Fig. 6 but for the southern subregions. The left panel is the SED of the subregion far from the core, while the right panel refers to the subregion near the core. |
Figure 8 shows the SED results obtained for the north and south lobes. The HE part of both spectra can be described by a power-law with photon index Γγ ≃ 2.2 and 2.6 for the north and the south lobe, respectively. At low energies, the south lobe spectrum shows a synchrotron peak at about 5 GHz, while the north lobe is well described by a power-law with an index > 2. Note that if one would use a simple power-law electron injection spectrum Q(γ) ∝ γ − α, evolving in time with a cooling break, to describe the HE γ-ray spectrum, a power index α = 3.2 would be required for the south lobe. Yet, assuming that the same electron population is responsible for both the radio-synchrotron and HE inverse-Compton emission, such a value would be in conflict with the results obtained from the WMAP data analysis, indicating an electron population with power-law index α ≃ 2 based on the detected synchrotron emission. As it turns out, however, this problem could be accommodated by considering a more natural spectral input shape, e.g., an electron injection spectrum with an exponential cut-off 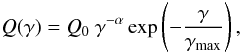 (3)where the constant Q0 can be obtained from the normalization to the injection power L = mec2∫Q(γ)γdγ.
The age of the giant lobe emission, and associated with this, the duration of particle acceleration activity, is somewhat uncertain. Dynamical arguments suggest a lower limit > 107 yr for the giant radio lobes, while synchrotron spectral aging arguments indicate an age ≲ 3 × 10⁷ yr (e.g., Israel 1998; Alvarez et al. 2000; Hardcastle et al. 2009). The observed GeV extension in itself would already imply an extreme lower limit of R/c > 106 yr. In the following we therefore discuss the SED implications for an epoch time t between 107 yr and 108 yr. As it turns out, the modeling of the GeV data provides support for a maximum lobe age of ~8 × 10⁷ yr.
For the south lobe, the radio data suggest a break frequency νbr = 5 GHz above which the spectrum drops abruptly. The break in the synchrotron spectrum is related to the break in the electron spectrum via  Hz. In principle, a change in the spectral shape of the electron population might be caused by cooling effects or/and the existence of a maximum energy for the electron population. For a minimum epoch time tmin = 107 yr, cooling would affect the synchrotron spectrum at frequency ≈ 80B1 μG GHz, much higher than inferred from the radio data. Therefore, to obtain a break at 5 GHz in the south lobe, a maximum energy in the electron population (γmax), lower than γbr defined by t = tmin would be needed. On the other hand, for a maximum epoch time tmax = 8 × 10⁷ yr, the power-law spectral index changes at frequency ≃ 1B1 μG GHz, providing a satisfactory agreement with the radio data. In this case the maximum electron energy is obtained from the radio data above the break frequency 5 GHz. Results for the considered minimum and maximum epoch time, and for a fixed power-law electron index α = 2 are illustrated in Figs. 8 and 9. Note that for B ≤ 3 μG, the energy loss rate P(γ) is dominated by the IC channel only, so that the results of the calculations are quite robust.
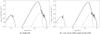 |
Fig. 8 Synchrotron and inverse-Compton fluxes for t = 107 yr. The radio data for the south lobe are from Hardcastle et al. (2009) (sum of region 4 and region 5 in their Table 1), while the radio data for the north region are from the WMAP analysis in this paper. The mean magnetic field value B used for the north and the south lobe is 0.39 μG and 0.43 μG, respectively. The dot-dashed line refers to the IC contribution due to EBL upscattering. |
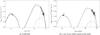 |
Fig. 9 Synchrotron and inverse-Compton fluxes for t = 8 × 10⁷ yr. The mean magnetic field value B for the south lobe and the γ-ray excess region in the north lobe is 0.91 μG and 1.17 μG, respectively. The dot-dashed line refers to the IC contribution due to EBL upscattering. The dashed line a) shows the result for t = 108 yr. The possible γ-ray flux expected from pp-interactions for a thermal gas density n = 10-4 cm-3 are also shown (dotted line). |
Figure 8 shows a representation of the SED for the north and the south lobe, respectively, using the parameters tmin = 107 yr and γmax = 1.5 × 10⁵. The dashed line shows the HE contribution produced by inverse-Compton scattering of CMB photons by relativistic electrons within the lobes. In this case the resulting γ-ray flux can only describe the first two data points and then drops rapidly. Consequently, to be able to account for the observed HE spectrum, EBL photons need to be included in addition to CMB photons (see dot-dashed line in Fig. 8). Upscattering of infrared-to-optical EBL photons was already required in the stationary leptonic model reported in the original Fermi paper (Abdo et al. 2010a). In our approach we adopt the model by Franceschini et al. (2008) to evaluate this EBL contribution. The solid line in Fig. 8 represents the total (CMB+EBL) inverse-Compton contribution. The maximum total energy of electrons in both lobes is found to be ~2 × 1058 erg and the energy in the magnetic fields is roughly 25% of this. Dividing the total energy by the epoch time 107 yr would imply a mean kinetic power of the jets inflating the lobes of ≃7 × 1043 erg s-1, roughly two orders of magnitude lower than the Eddington power inferred for the black hole mass in Cen A, yet somewhat above the estimated power of the kpc-scale jet in the current epoch of jet activity (Croston et al. 2009). This could indicate that the jet was more powerful in the past. Obviously, the requirement on the mean jet power can be significantly reduced if one assumes an older age of the lobes.
Figure 9 shows a representation of the SED for an epoch time tmax = 8 × 10⁷ yr, with a maximum electron Lorentz factor γmax = 2.5 × 10⁶ and 1.5 × 10⁶ for the north lobe and the south lobe, respectively. Note that in this case the contribution by inverse-Compton scattering of CMB photons alone is sufficient to account for the observed HE spectrum (see the solid line in Fig. 9). The inverse-Compton contribution of EBL photons only becomes important at higher energies (see the dot-dashed line in Fig. 9). On the other hand, for an epoch time t exceeding tmax = 8 × 10⁷ yr, the high-energy part of the SED would no longer be consistent with the data (see the dashed line in Fig. 9 for t = 108 yr). This could be interpreted as additional evidence for a finite age < 108 yr of the lobes. The maximum total energy of electrons in both lobes is found to be ≈6 × 1057 erg, with the total energy in particles and fields comparable to the 107 yr-case, thus requiring only a relatively modest mean kinetic jet power of ~1043 erg s-1.
4.2. Hadronic γ-rays?
Once protons are efficiently injected, they are likely to remain energetic since the cooling time for pp-interactions is tpp ≈ 1015(n/1 cm-3)-1 s. High-energy protons interacting with the ambient low-density plasma can then produce daughter mesons and the π0 component decays into two γ-rays. The data reported here allow us to derive an upper limit on the energetic protons contained in the lobes of Cen A. As before, we use a power-law proton distribution with an exponential cut-off, i.e.,  where the constant N0 can be expressed in terms of the total proton energy
  . Current estimates for the thermal plasma density in the giant radio lobes of Cen A suggest a value in the range n ≃ (10-5 − 10-4) cm-3 (e.g., Isobe et al. 2001; Feain et al. 2009). We used n = 10-4 cm-3 for the model representation shown in dotted line in Fig. 9. In both lobes, the power-law index of the proton population is α = 2.1, and the high-energy cut-off is Emax ≃ 55 GeV. The maximum total energy Wp is proportional to the gas number density n, so that Wp ≃ 1061(n/10-4 cm-3)-1 erg, obtained here, should be considered as an upper limit. In principle, protons could be accumulated over the whole evolutionary timescale of the lobes. For a long timescale of ≥ 109 yr, an average injection power ≤ 3 × 1044 erg s-1 and a mean cosmic-ray diffusion coefficient of D ~ R2/t ≲ 3 × 1030(R/100 kpc)2 cm2/s would be needed.
5. Discussion and conclusion
Results based on an detailed analysis of 3 yr of Fermi-LAT data on the giant radio lobes of Cen A are described in this paper. We have shown that the detection of the HE lobes with a significance more than twice as high as reported before (i.e., with more than 10 and 20σ for the northern and the southern lobe, respectively) allows a better determination of their spectral features and morphology. A comparison of the Fermi-LAT data with WMAP data indicates that the HE γ-ray emission regions do not fully coincide with the radio lobes. There is of course no a priori reason for them to coincide. The results reported here particularly support a substantial HE γ-ray extension beyond the WMAP radio image for the northern lobe of Cen A. We have reconstructed the SED based on data from the same emission region. A satisfactory representation is possible in a time-dependent leptonic scenario with radiative cooling taken into account self-consistently and injection described by a single power-law with exponential cut-off. The results imply a finite age <108 yr of the lobes and a mean magnetic field strength B ≲ 1 μG. While for lobe lifetimes on the order of 8 × 10⁷ yr, inverse-Compton up-scattering of CMB photons alone would be sufficient to account for the observed HE spectrum, up-scattering of EBL photons is needed for shorter lobe lifetimes. In a leptonic framework, the HE emission directly traces (via inverse-Compton scattering) the underlying relativistic electron distribution and thereby provides a spatial diagnostic tool. The radio emission, arising from synchrotron radiation, on the other hand also traces the magnetic field distribution. Together, the HE γ-ray and the radio emission thus offer important insights into the physical conditions of the source. That the HE emission seems extended beyond the radio image could then be interpreted as caused by a change in the magnetic field characterizing the region. This would imply that our quasi-homogeneous SED model for the HE lobes can only serve as a first-order approximation and that more detailed scenarios need to be constructed to fully describe the data. This also applies to the need of incorporating electon re-acceleration self-consistently. Extended HE emission could in principle also be related to a contribution from hadronic processes. The cooling timescales for protons appear much more favorable. On the other hand, both the spectral shape of the lobes and the required energetics seem to disfavor
pp-interaction processes as sole contributor. One of the insights emerging from the present paper is the need for a more detailed theoretical SED approach to be able to take full advantage of the current observational capabilities.
Acknowledgments
Constructive comments by the anonymous referee are gratefully acknowledged.
References
- Abdo, A. A., Ackermann, M., Ajello, M., et al. (Fermi-LAT Collaboration) 2010a, Science, 328, 725 [NASA ADS] [CrossRef] [PubMed] [Google Scholar]
- Abdo, A. A., Ackermann, M., Ajello, M., et al. (Fermi-LAT Collaboration) 2010b, ApJ, 719, 1433 [NASA ADS] [CrossRef] [Google Scholar]
- Aharonian, F. A., & Atoyan, A. M. 1981, Ap&SS, 79, 321 [NASA ADS] [Google Scholar]
- Aharonian, F., Akhperjanian, A. G., Anton, G., et al. (H.E.S.S. Collaboration) 2009, ApJ, 695, L40 [NASA ADS] [CrossRef] [Google Scholar]
- Alvarez, H., Aparici, J., May, J., & Reich, P. 2000, A&A, 355, 863 [NASA ADS] [Google Scholar]
- Atoyan, A. M., & Aharonian, F. A. 1999, MNRAS, 302, 253 [NASA ADS] [CrossRef] [Google Scholar]
- Atwood, W. B., Abdo, A. A., Ackermann, M., et al. (Fermi-LAT Collaboration) 2009, ApJ, 697, 1071 [NASA ADS] [CrossRef] [Google Scholar]
- Burns, J. O., Feigelson, E. D., & Schreier, E. J. 1983, ApJ, 273, 128 [NASA ADS] [CrossRef] [Google Scholar]
- Croston, J. H., Kraft, R. P., Hardcastle, M. J., et al. 2009, MNRAS, 395, 1999 [NASA ADS] [CrossRef] [Google Scholar]
- Feain, I. J., Ekers, R. D., Murphy, T., et al. 2009, ApJ, 707, 114 [NASA ADS] [CrossRef] [Google Scholar]
- Ferrarese, L., Mould, J. R., Stetson, P. B., et al. 2007, ApJ, 654, 186 [NASA ADS] [CrossRef] [Google Scholar]
- Franceschini, A., Rodighiero, G., & Vaccari, M. 2008, A&A, 487, 837 [NASA ADS] [CrossRef] [EDP Sciences] [Google Scholar]
- Hardcastle, M. J., & Croston, J. H. 2005, MNRAS, 363, 649 [NASA ADS] [Google Scholar]
- Hardcastle, M. J., Cheung, C. C., Feain, I. J., & Stawarz, L. 2009, MNRAS, 393, 104 [Google Scholar]
- Isobe, N., Makishima, K., Tashiro, M., & Kaneda, H. 2001, ASPC, 250, 394 [NASA ADS] [Google Scholar]
- Israel, F. P. 1998, A&ARv, 8, 237 [NASA ADS] [CrossRef] [Google Scholar]
- Nolan, P. L., Abdo, A. A., Ackermann, M., et al. (Fermi-LAT Collaboration) 2012, ApJS, 199, 31 [NASA ADS] [CrossRef] [Google Scholar]
- O’Sullivan, S., Reville, B., & Taylor, A. 2009, MNRAS, 400, 248 [NASA ADS] [CrossRef] [Google Scholar]
- Page, L., Barnes, C., Hinshaw, G., et al. 2003, ApJS, 148, 39 [NASA ADS] [CrossRef] [Google Scholar]
- Komatsu, E., Smith, K. M., Dunkley, J., et al. (WMAP Collaboration) 2011, ApJS, 192, 18 [NASA ADS] [CrossRef] [Google Scholar]
- Rieger, F. M. 2011, IJMPD, 20, 1547 [NASA ADS] [CrossRef] [Google Scholar]
- Shain, C. A. 1958, Aust. J. Phys., 11, 517 [NASA ADS] [CrossRef] [Google Scholar]
- Steinle, H. 2010, PASA, 27, 431 [NASA ADS] [CrossRef] [Google Scholar]
- http://fermi.gsfc.nasa.gov/ssc/data/analysis/documentation/Cicerone/ [Google Scholar]
- http://fermi.gsfc.nasa.gov/ssc/data/analysis/documentation/Pass7_usage.html [Google Scholar]
All Tables
All Figures
|
Fig. 1 The different maps for the Cen A region: a) LAT counts map of the 14° × 14° region of interest (ROI) around the position of Cen A. The counts map is smoothed with a Gaussian of kernel 0.8°. The green crosses mark the position of the 2FGL point-like sources. b) Excess map after subtraction of diffuse background, point-like sources and Cen A core. The contours are WMAP radio lobe contours, while the white boxes represent the projection regions discussed in Sect. 2.1. c) Residual map using template T1 for the lobes. d) Residual map using the radio template T2 for the lobes. |
| In the text | |
|
Fig. 2 Two templates used in the analysis. The blue contours correspond to T1 and the red to T2. |
| In the text | |
|
Fig. 3 Projection of the rectangular region shown in Fig. 1b for both lobes. The curves are Gaussian fits, with WMAP data in red and Fermi-LAT data in black. Units for the positional (x) axis are degrees. |
| In the text | |
|
Fig. 4 SED for template T1. Squares and crosses are for the north lobe and the south lobe, respectively. The ratio of the fluxes (north/south) are shown in the bottom panel. |
| In the text | |
|
Fig. 5 Two lobes divided into two parts (near core of Cen A core and farther away) for spectral comparison. The contours in different colors represent the different parts. |
| In the text | |
|
Fig. 6 SEDs for the corresponding subregions in the north. The left panel is the SED of the subregion far from the core, while the right panel refers to the subregion near the core. The colors are the same as used in the definition in Fig. 5. |
| In the text | |
|
Fig. 7 Same as Fig. 6 but for the southern subregions. The left panel is the SED of the subregion far from the core, while the right panel refers to the subregion near the core. |
| In the text | |
|
Fig. 8 Synchrotron and inverse-Compton fluxes for t = 107 yr. The radio data for the south lobe are from Hardcastle et al. (2009) (sum of region 4 and region 5 in their Table 1), while the radio data for the north region are from the WMAP analysis in this paper. The mean magnetic field value B used for the north and the south lobe is 0.39 μG and 0.43 μG, respectively. The dot-dashed line refers to the IC contribution due to EBL upscattering. |
| In the text | |
|
Fig. 9 Synchrotron and inverse-Compton fluxes for t = 8 × 10⁷ yr. The mean magnetic field value B for the south lobe and the γ-ray excess region in the north lobe is 0.91 μG and 1.17 μG, respectively. The dot-dashed line refers to the IC contribution due to EBL upscattering. The dashed line a) shows the result for t = 108 yr. The possible γ-ray flux expected from pp-interactions for a thermal gas density n = 10-4 cm-3 are also shown (dotted line). |
| In the text | |
Current usage metrics show cumulative count of Article Views (full-text article views including HTML views, PDF and ePub downloads, according to the available data) and Abstracts Views on Vision4Press platform.
Data correspond to usage on the plateform after 2015. The current usage metrics is available 48-96 hours after online publication and is updated daily on week days.
Initial download of the metrics may take a while.