Fig. 1
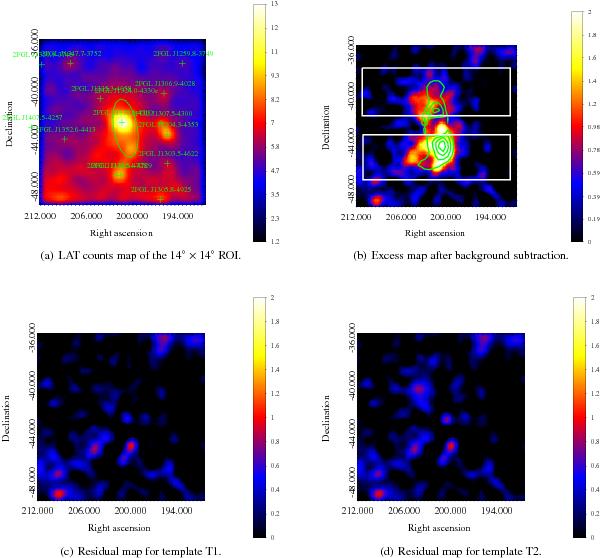
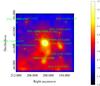
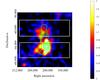
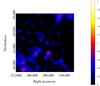
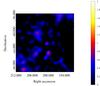
The different maps for the Cen A region: a) LAT counts map of the 14° × 14° region of interest (ROI) around the position of Cen A. The counts map is smoothed with a Gaussian of kernel 0.8°. The green crosses mark the position of the 2FGL point-like sources. b) Excess map after subtraction of diffuse background, point-like sources and Cen A core. The contours are WMAP radio lobe contours, while the white boxes represent the projection regions discussed in Sect. 2.1. c) Residual map using template T1 for the lobes. d) Residual map using the radio template T2 for the lobes.
Current usage metrics show cumulative count of Article Views (full-text article views including HTML views, PDF and ePub downloads, according to the available data) and Abstracts Views on Vision4Press platform.
Data correspond to usage on the plateform after 2015. The current usage metrics is available 48-96 hours after online publication and is updated daily on week days.
Initial download of the metrics may take a while.