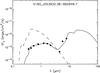
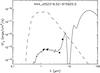
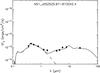
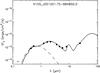
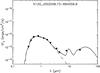
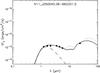
Fig. 3
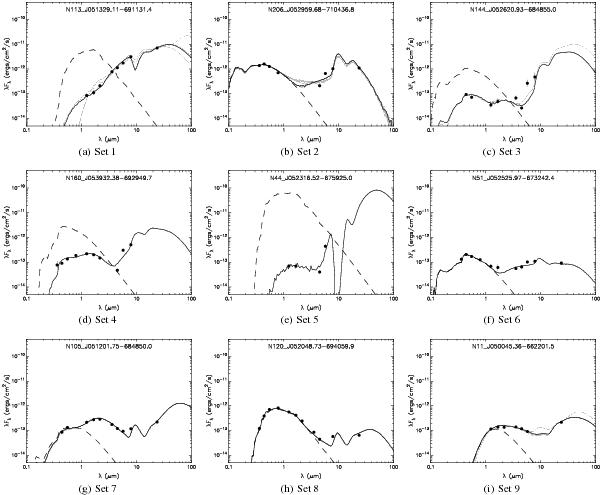
Example SED for each selection Set detailed in Table 4. Error bars on fluxes are shown but usually less than the size of the dot. The best fit is shown in black with other fits with  shown in grey. The dashed line shows the photospheric emission from the central source. These are the same fits used to determine approximate physical and evolutionary properties. SEDs shown in a), c), d), and e) are classified as Stage i, i) as Stage i/ii, f) and h) as Stage ii, and b) and g) as Stage iii. The characteristic dip in SED c) at 4.5 μm, compared to the other three IRAC bands, indicates the presence of strong PAH emission, and error bars have been increased in 3.6, 5.8, and 8.0 μm, as described in the text.
Current usage metrics show cumulative count of Article Views (full-text article views including HTML views, PDF and ePub downloads, according to the available data) and Abstracts Views on Vision4Press platform.
Data correspond to usage on the plateform after 2015. The current usage metrics is available 48-96 hours after online publication and is updated daily on week days.
Initial download of the metrics may take a while.