Fig. 5
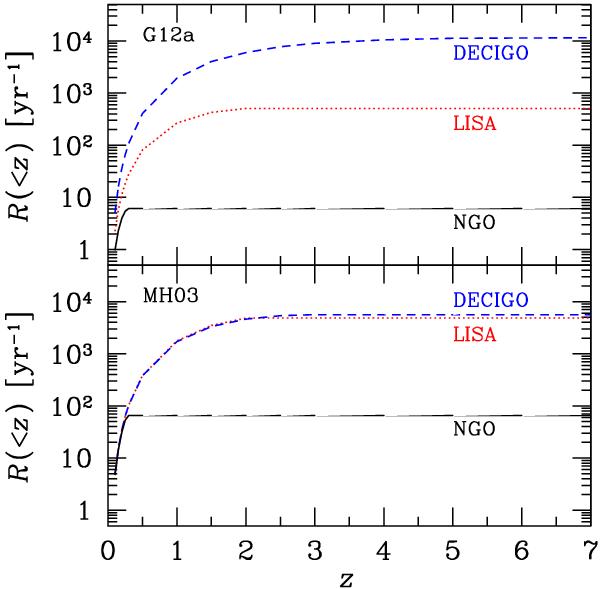
Cumulative redshift distribution of the expected detections per year, in the case of LISA (dotted line, red on the web), DECIGO (dashed line, blue on the web) and NGO (solid line). For each case, j = 1, eLSO = 0.1, t0 = 5 yr, Tmission = 5 yr (see Tables 1–3), p = 1.06 × 10⁻²,  and tloss = 107 yr. Top panel: mSMBH − msph relation set according to G12a. Bottom panel: mSMBH − msph relation set according to MH03.
Current usage metrics show cumulative count of Article Views (full-text article views including HTML views, PDF and ePub downloads, according to the available data) and Abstracts Views on Vision4Press platform.
Data correspond to usage on the plateform after 2015. The current usage metrics is available 48-96 hours after online publication and is updated daily on week days.
Initial download of the metrics may take a while.