Free Access
Fig. 2
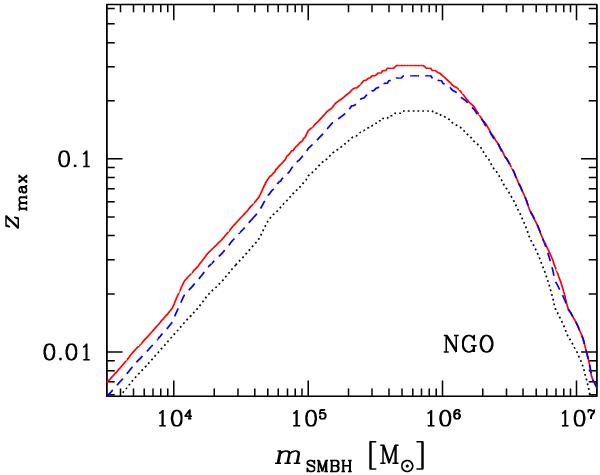
zmax in the case of NGO, as a function of mSMBH for three different simulations. In all the shown models, j = 1 and Tmission = t0 = 5 yr (see Table 2). Solid line (red on the web): model with eLSO = 0.3. Dashed line (blue on the web): model with eLSO = 0.5. Dotted black line: model with eLSO = 0.7.
Current usage metrics show cumulative count of Article Views (full-text article views including HTML views, PDF and ePub downloads, according to the available data) and Abstracts Views on Vision4Press platform.
Data correspond to usage on the plateform after 2015. The current usage metrics is available 48-96 hours after online publication and is updated daily on week days.
Initial download of the metrics may take a while.