Fig. 7
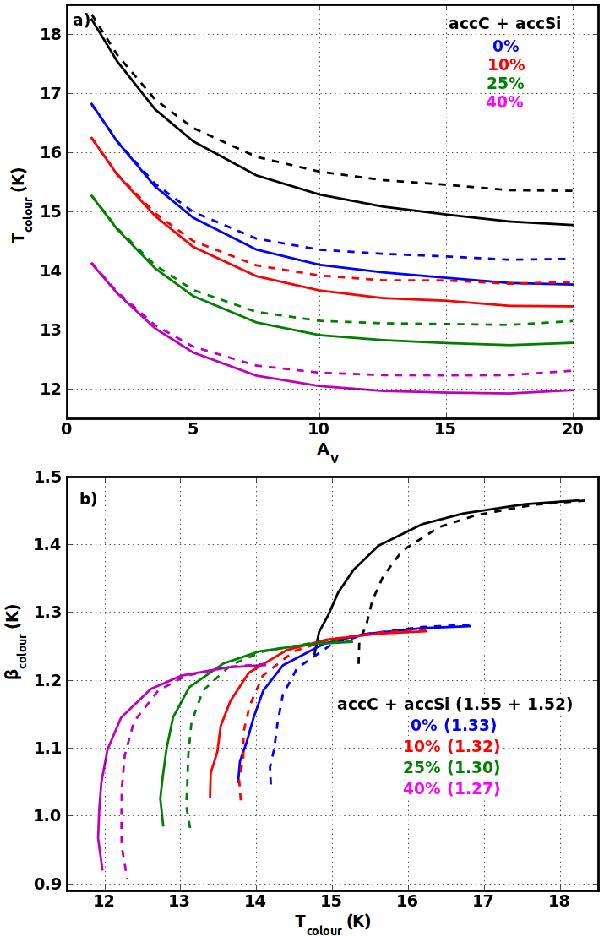
a) Colour temperature as a function of visual extinction for the central pixel. Results are shown for accreted and aggregated grains as defined in Table 2. Solid lines show the colour temperature calculated by fitting the SEDs between 100 μm and 3000 μm, and the dashed lines in the Planck-HFI bands as defined in Sect. 2.4. The black line shows the case of accreted grains, the blue line of aggregates without porosity, red of a porosity degree of 10%, green 25%, and magenta 40%, as defined in Table 2. The true grain temperatures, Tdust, can be seen in Fig. 8. b) Emissivity spectral index as a function of colour temperature. Line styles are the same as in the top figure. The numbers in parenthesis are the intrinsic opacity spectral indices of the different grain populations.
Current usage metrics show cumulative count of Article Views (full-text article views including HTML views, PDF and ePub downloads, according to the available data) and Abstracts Views on Vision4Press platform.
Data correspond to usage on the plateform after 2015. The current usage metrics is available 48-96 hours after online publication and is updated daily on week days.
Initial download of the metrics may take a while.