| Issue |
A&A
Volume 542, June 2012
|
|
|---|---|---|
| Article Number | A21 | |
| Number of page(s) | 20 | |
| Section | Interstellar and circumstellar matter | |
| DOI | https://doi.org/10.1051/0004-6361/201118420 | |
| Published online | 28 May 2012 | |
Online material
Appendix A: Details regarding the spectral variations in the emissivity spectral index
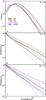 |
Fig. A.1
a) SEDs for the central pixel of the cloud with central AV = 10 for a mixture of LamC and aSil (black), LamC and ENSTA (magenta), LamC and OLIVA (blue), ACAR and aSil (red), BE and aSil (green). b) Emissivity normalised at 100 μm for the cloud with central AV = 10, for a mixture of LamC and aSil (black solid line), of ACAR and aSil (red solid line), and of BE and aSil (green solid line). Absorption efficiencies normalised at 100 μm: aSil (black dotted line), LamC (black dashed line), ACAR (red dashed line), and BE (green dashed line). c) Emissivity normalised at 100 μm for the cloud with central AV = 10, for a mixture of LamC and aSil (black solid line), of LamC and ENSTA (magenta solid line), and of LamC and OLIVA (blue solid line). Absorption efficiencies normalised at 100 μm: aSil (black dotted line), LamC (black dashed line), ENSTA (magenta dashed line), and OLIVA (blue dashed line). |
| Open with DEXTER | |
We use the ten clouds described in Table 3 (diffuse medium case), illuminated by the ISRF, and consider five different mixtures of grains: LamC and aSil (see Table 2), ACAR and aSil, BE and aSil, LamC and ENSTA, and LamC and OLIVA (see Sect. 5.1 for a description of their optical properties). The corresponding SEDs and (βcolour − Tcolour)-parameters, obtained with fits between 100 and 3000μm, are shown in Figs. A.1a and A.2.
All the mixtures containing LamC grains have similar colour temperatures, Tcolour, regardless of the silicate population (aSil, ENSTA, or OLIVA). If the LamC grains are replaced by ACAR or BE grains, the colour temperature drops. This decrease is due to their higher emissivity in the far-IR and shows that the colour temperature is dominated by the temperature of the carbonaceous populations, which are always the warmest.
The populations of ENSTA and OLIVA grains have very different optical properties in the submillimetre (Fig. 9b). This reappears in the fitted values of the emissivity spectral index, βcolour, which are much higher for a mixture containing OLIVA grains ( ) than for a mixture containing ENSTA grains (
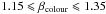 , see Fig. A.2).
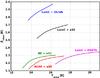 |
Fig. A.2
Emissivity spectral index as a function of colour temperature for fits of the dust SEDs between 100 and 3000μm for the central pixels of the modelled clouds. Linestyles are the same as in Fig. A.1a). |
| Open with DEXTER | |
Finally, Figs. A.1b and c show the spectral variations in the emissivities of the different mixtures of grains, which are measured using Eq. (7). For all the mixtures containing aSil grains, for  m, the spectral variations in the emissivity perfectly reflect the spectral variations in the absorption efficiencies, Qabs, of the carbonaceous grains. For the mixture containing LamC and OLIVA grains, the carbonaceous grains still dominate the spectral variations in the emissivity for
  m. However, if we replace the OLIVA by ENSTA grains, this is no longer true and the population of silicates dominates the spectral variations for m. This illustrates the strong dependence of the emissivity spectral variations on the dust populations considered. However, the relatively simple behaviours described here are all mixed up if we consider that the optical properties of both the silicates and the carbons undergo spectral variations in the far-IR and in the submillimetre (see Sect. 5.1 for a detailed description). As a result, it might be quite difficult to track back the nature of the grains from the spectral variations in the dust SED.
Appendix B: The case of Bonnor-Ebert spheres
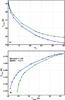 |
Fig. B.1
a) Same as Fig. 1c in the case of Bonnor-Ebert spheres. b) Same as Fig. 1d in the case of Bonnor-Ebert spheres. |
| Open with DEXTER | |
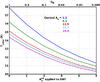 |
Fig. B.2
Same as Fig. 2 in the case of Bonnor-Ebert spheres. The blue line shows a sphere with AV = 1.2 at the centre, green shows 6.3, red 12.5, and magenta 20.9. |
| Open with DEXTER | |
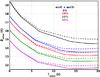 |
Fig. B.3
Same as Fig. 7a in the case of Bonnor-Ebert spheres. |
| Open with DEXTER | |
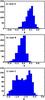 |
Fig. B.4
Same as Fig. 4c in the case of Bonnor-Ebert spheres, for a signal-to-noise ration at 250 μm greater than a) 8.3 (case A), b) 4.2 (case B), and c) 1.7 (case C). |
| Open with DEXTER | |
Parameters describing the gas distribution of the Bonnor-Ebert spheres.
To test the influence of the shape of the clouds on our results, we study the case of externally heated Bonnor-Ebert spheres, which are isothermal spheres at hydrostatic equilibrium (Bonnor 1956; Ebert 1955). We consider almost critically stable spheres with ζ = 6.5, or similarly ρC/ρ(R) = 14.1, where ζ is the dimensionless length equal to  and cS is the isothermal sound speed, G the gravitational constant, and r the radius. We assume a constant kinetic gas temperature of Tgas = 12 K. Fischera (2011) showed that the choice of ζ and Tgas has a minor influence on the dust temperature, which depends mainly on the column density. The modelled clouds are
divided into 50 concentric cells (see Sect. 2.2) and the emission maps produced have 85 × 85 pixels with a single pixel size equal to 0.6% of the radius of the cloud. We vary the masses of the spheres between 0.2 and 100 M⊙ to get central hydrogen column densities ranging from 2.5 × 10²⁰ to 5 × 10²² H/cm-2, or central AV = 0.1 to 17.7 in the case of DHGL grain populations. The parameters describing the spheres are shown in Table B.1.
For comparison with the cylindrical clouds presented in the main body of the paper, we measure the βcolour and Tcolour parameters for Bonnor-Ebert spheres with DHGL dust populations illuminated by the ISRF (Fig. B.1), or by the ISRF extinguished by an external radiation field  up to 5 (Fig. B.2). Figure B.3 shows the case where Bonnor-Ebert spheres, illuminated by the ISRF, contain accC and accSi populations or aggregates with various porosity fractions. The values of the colour temperatures and the emissivity spectral indices vary when compared to the case of cylindrical clouds, although in all cases, the trends are similar. This means that the results described in the main body of the text in the case of cylinders hold for externally heated Bonnor-Ebert spheres.
We now study the effects of noise on the βcolour − Tcolour relations measured in Bonnor-Ebert spheres for observations in Herschel channels (PACS and SPIRE). The procedure is exactly the same as in Sect. 3.2 but we examine three cases depending on the 250 μm peak surface brightness after convolution with the beam (the column density range covered by the modelled Bonnor-Ebert spheres is indeed larger than for the cylinders). For case A, we exclude the clouds with S/N at 250 μm lower than 8.3 ( ⇔ S250μm < 10 MJy/sr, excludes all clouds with  ), for case B lower than 4.2 ( ⇔ S250μm < 5 MJy/sr,
  ), and for case C lower than 1.7 ( ⇔ S250μm < 2 MJy/sr,
  ). The results are presented in Fig. B.4. In case A, the correlation between βcolour and Tcolour remains positive. In case B, a slight anti-correlation appears (
 ), but cannot account alone for the steep anti-correlation observed towards interstellar clouds (
 ). In case C, where we include the nine modelled clouds with the lowest S/N’s, an anti-correlation appears and is steeper than B = −1 for more than half of the simulated cloud samples. The few faint clouds with a low S/N are responsible for the strong anti-correlation measured.
© ESO, 2012
Current usage metrics show cumulative count of Article Views (full-text article views including HTML views, PDF and ePub downloads, according to the available data) and Abstracts Views on Vision4Press platform.
Data correspond to usage on the plateform after 2015. The current usage metrics is available 48-96 hours after online publication and is updated daily on week days.
Initial download of the metrics may take a while.