Fig. 3
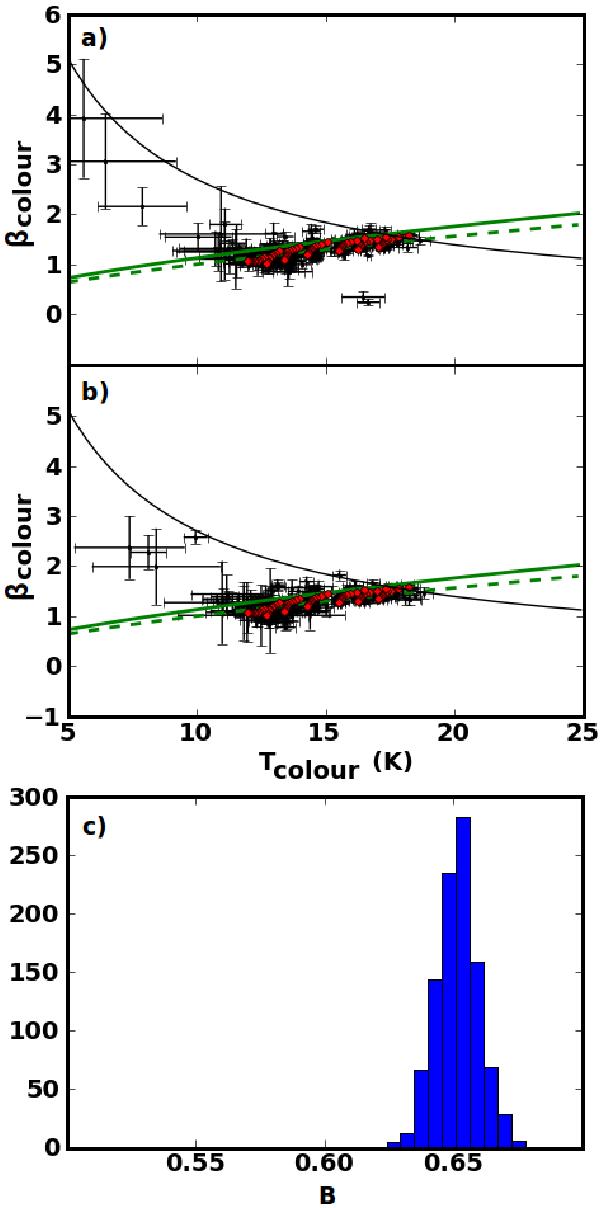
a), b) Two examples of the (Tcolour, βcolour) distributions for the observations simulated in the Planck-HFI and IRAS 100 μm bands for the central pixels of the series of filaments described in Table 3. The red squares show the results of the fits for the clouds described in Sect. 3.1, containing DHGL grain populations and illuminated by the ISRF, extinguished or not, without noise (10 clouds × 7 radiation fields). The black crosses show the same after adding the estimated statistical noise to the simulated data (the length of the arms of the black crosses are the error bars). The green dashed lines are the power-law fits of these two particular realisations and the green solid line corresponds to the average relation over the 1000 cases. For clarity, the plot includes only every 50th of the 14 000 points (see Sect. 3.2 for details). The black line is the fit to the observed βcolour − Tcolour relation measured by Planck Collaboration (2011c) towards cold clumps with Planck-HFI and IRAS 100 μm bands. c) Probability distribution of the B parameter obtained from 1000 cloud samples, similar to the two examples in the upper frames (with B defined as  , see Sect. 3.2 for details).
Current usage metrics show cumulative count of Article Views (full-text article views including HTML views, PDF and ePub downloads, according to the available data) and Abstracts Views on Vision4Press platform.
Data correspond to usage on the plateform after 2015. The current usage metrics is available 48-96 hours after online publication and is updated daily on week days.
Initial download of the metrics may take a while.