Fig. 1
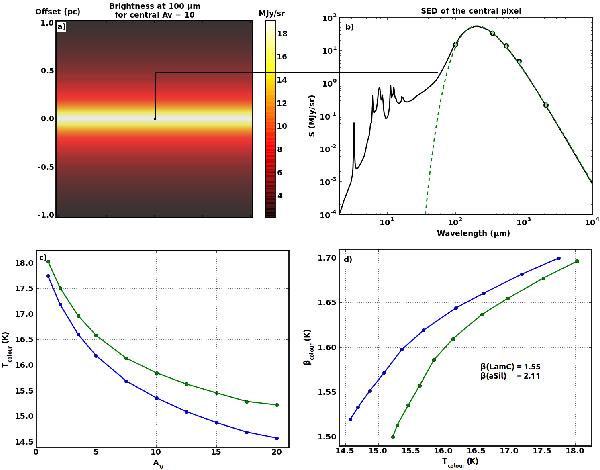
Case of DHGL populations. a) 100 μm brightness map of the cloud with AV = 10 at the centre. b) The black solid line is the SED of the central pixel and the black circles are the same SED integrated in Planck-HFI bands (143, 353, 545, 857 GHz) and IRIS 100 μm band. The green dashed line is the best fit between 100 μm and 3000 μm, and the green diamonds show the best fit for the SED integrated in the IRIS 100 μm and in the Planck-HFI bands. c) Colour temperature as a function of visual extinction for the central pixel for a series of models with different central AV (see Table 3). The blue line shows the colour temperatures obtained by fitting the SEDs between 100 μm and 3000 μm, and the green line when the fit is made in the Planck-HFI and IRIS bands as defined in Sect. 3. d) Emissivity spectral index, βcolour, as a function of the colour temperature. Line styles are the same as in the previous figure. β(LamC) and β(aSil) are the intrinsic opacity spectral indices of the LamC and aSil populations. The true grain temperatures, Tdust, can be seen in Fig. 8.
Current usage metrics show cumulative count of Article Views (full-text article views including HTML views, PDF and ePub downloads, according to the available data) and Abstracts Views on Vision4Press platform.
Data correspond to usage on the plateform after 2015. The current usage metrics is available 48-96 hours after online publication and is updated daily on week days.
Initial download of the metrics may take a while.