Fig. 8
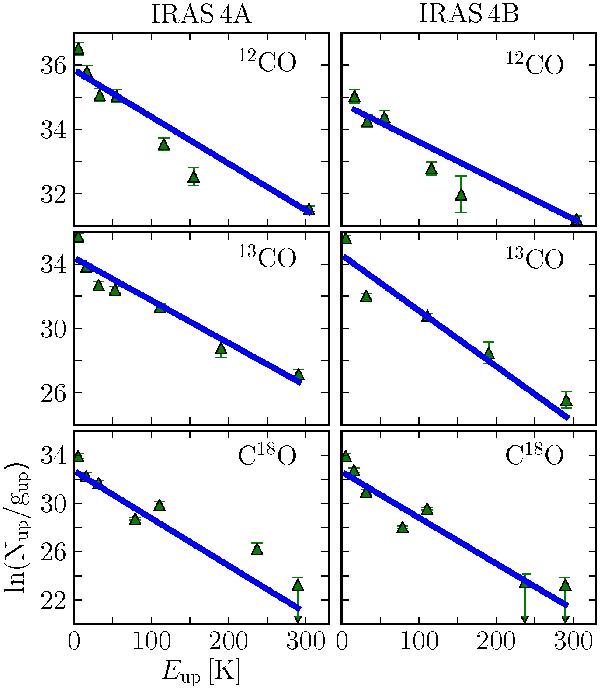
Rotation diagrams measured for the CO and isotopolog lines at the source positions of IRAS 4A and 4B. The column density of each observation in each rotational level divided by the statistical weight is plotted against the excitation energy of the level. The fitted line shows the Boltzmann distribution of the rotational populations. Derived values of the rotation temperatures are presented in Table 4.
Current usage metrics show cumulative count of Article Views (full-text article views including HTML views, PDF and ePub downloads, according to the available data) and Abstracts Views on Vision4Press platform.
Data correspond to usage on the plateform after 2015. The current usage metrics is available 48-96 hours after online publication and is updated daily on week days.
Initial download of the metrics may take a while.