Free Access
Fig. 17
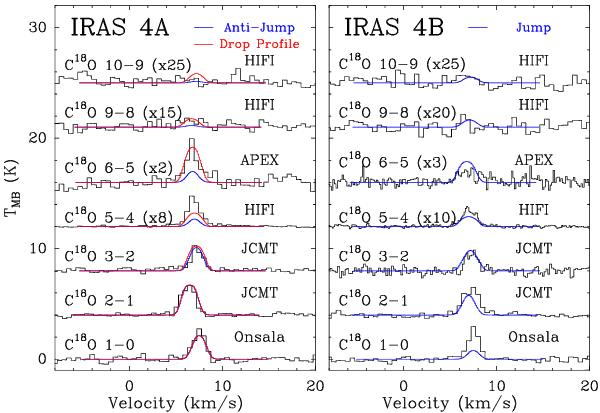
Left: line profiles obtained with the best-fit anti-jump (blue) and drop abundance (red) envelope models overplotted on the observed C18O lines in IRAS 4A. Right: similar best-fit jump abundance profile for IRAS 4B. See Table 7 for best-fit parameters.
This figure is made of several images, please see below:
Current usage metrics show cumulative count of Article Views (full-text article views including HTML views, PDF and ePub downloads, according to the available data) and Abstracts Views on Vision4Press platform.
Data correspond to usage on the plateform after 2015. The current usage metrics is available 48-96 hours after online publication and is updated daily on week days.
Initial download of the metrics may take a while.