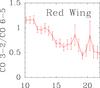
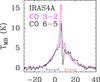
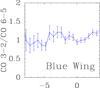
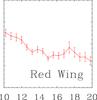
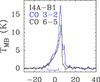
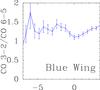
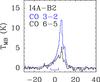
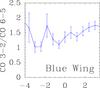
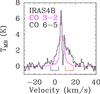
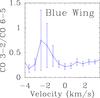
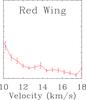
Fig. 10
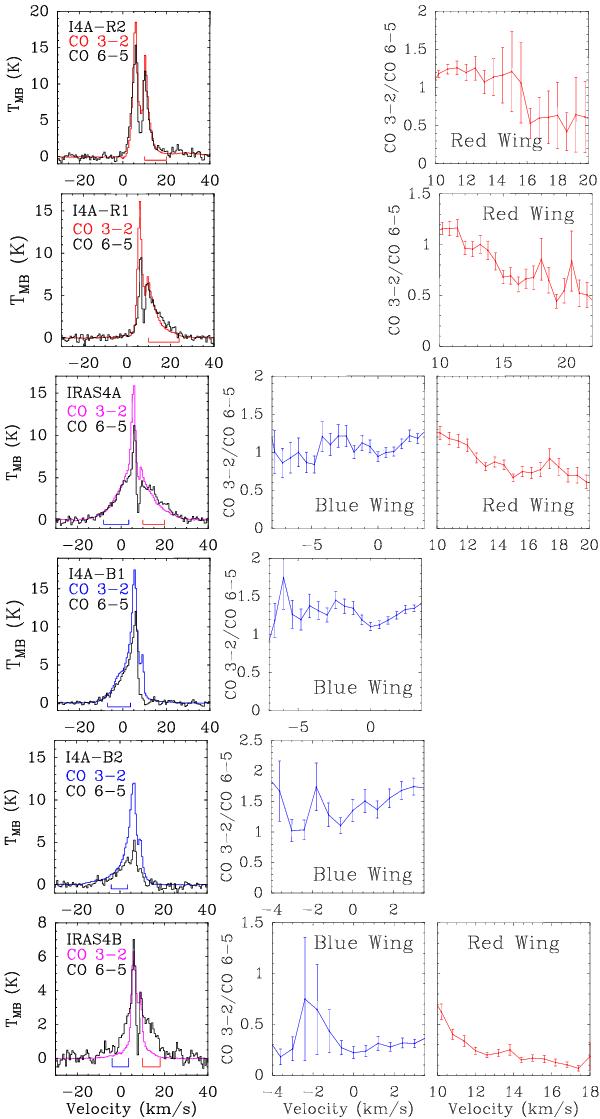
Ratio of the TMB temperatures of 12CO 3–2/12CO 6–5. From top to bottom; left hand column shows IRAS 4A red outflow knots I4A-R2, I4A-R1, central source, blue outflow knots I4A-B1, I4A-B2 and IRAS 4B central source positions. Coordinates of these positions are given in Table 2. The spectra are binned to 0.6 km s-1. The blue and red masks under the spectra in the left column show the range is used for the ratio calculations. Right hand column shows the ratios of these transitions.
Current usage metrics show cumulative count of Article Views (full-text article views including HTML views, PDF and ePub downloads, according to the available data) and Abstracts Views on Vision4Press platform.
Data correspond to usage on the plateform after 2015. The current usage metrics is available 48-96 hours after online publication and is updated daily on week days.
Initial download of the metrics may take a while.