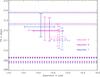
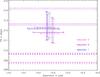
Fig. 7
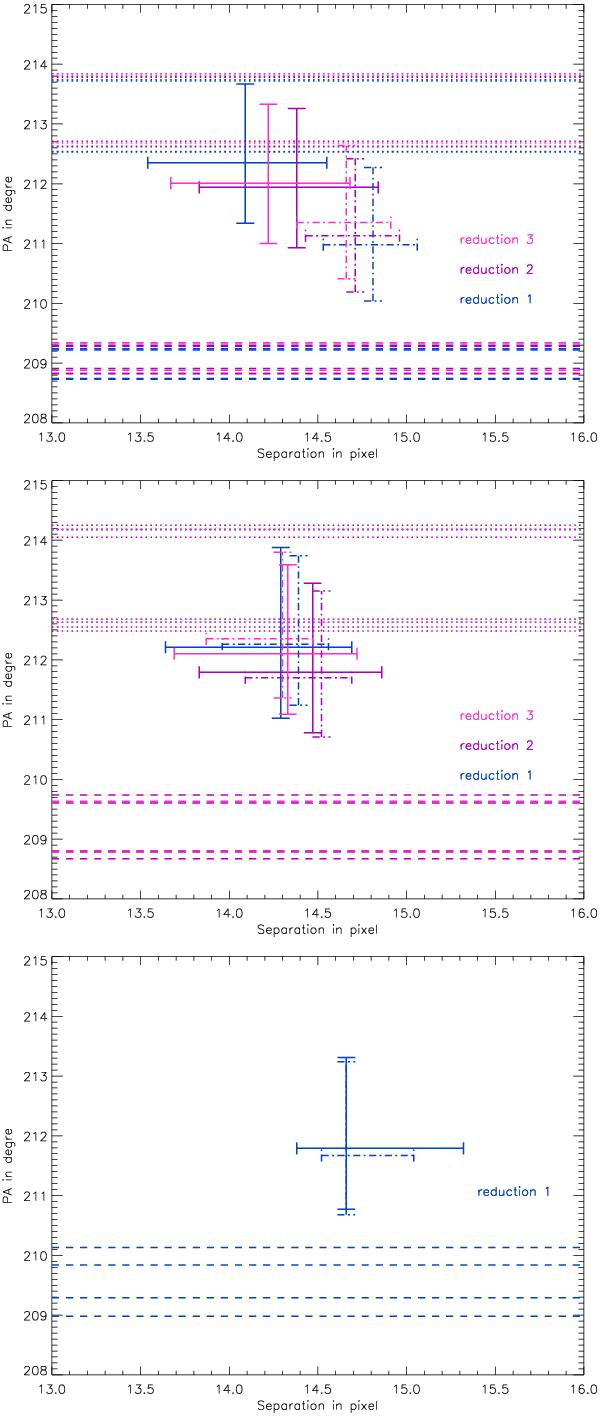
Top: position of β Pic b together with errors bars measured on 3 different cADI images (mean of the residuals). The full lines correspond to mean cADI data, the dashed lines correspond to measurements on median cADI data. Dashed horizontal lines shows the min and max PAs of the main disk and dotted ones the min and max PAs of the warp component. Conservative error bars have been taken into account. Middle: idem for sADI data. Bottom: idem for rADI data.
Current usage metrics show cumulative count of Article Views (full-text article views including HTML views, PDF and ePub downloads, according to the available data) and Abstracts Views on Vision4Press platform.
Data correspond to usage on the plateform after 2015. The current usage metrics is available 48-96 hours after online publication and is updated daily on week days.
Initial download of the metrics may take a while.