| Issue |
A&A
Volume 542, June 2012
|
|
|---|---|---|
| Article Number | A120 | |
| Number of page(s) | 6 | |
| Section | Extragalactic astronomy | |
| DOI | https://doi.org/10.1051/0004-6361/201118109 | |
| Published online | 18 June 2012 | |
Chandra, Swift, and HST studies of the CXOM31 J004253.1+411422
Very bright X-ray transient in M 31
1 Dublin Institute for Advanced Studies, 31 Fitzwilliam Place, Dublin 2, Ireland
e-mail: This email address is being protected from spambots. You need JavaScript enabled to view it.
2 University College Cork, Cork, Ireland
3 Smithsonian Astrophysical Observatory, 60 Garden Street, Cambridge, MA 02138, USA
4 Johns Hopkins University, Physics and Astronomy, 3400 N Charles Street, Baltimore, MD 21218, USA
Received: 16 September 2011
Accepted: 7 April 2012
Abstract
Context. A very bright transient X-ray source, CXOM 31 J004253.1+411422, was found by Chandra/HRC in the M 31 bulge. We present Chandra, Swift, and Hubble Space Telescope (HST) observations of this source.
Aims. Since this source is the brightest known X-ray transient in M 31, we want to study its nature with Chandra and Swift. Comparing the results of Galactic transients and M 31 transients can give a better understanding of the nature of extragalactic binaries.
Methods. We fitted disk black body and power law models to X-ray data from Chandra and Swift. Follow-up HST/ACS imaging during and after the outburst revealed a transient optical counterpart.
Results. Our HST observations show an optical counterpart with optical magnitude B = 23.91 ± 0.08. Using the empirical relations between X-ray luminosity and absolute visual magnitude, we estimate the orbital period of the system is about ~15 h.
Conclusions. Our optical identification of the brightest X-ray transient so far discovered in M 31 suggests an orbital period of about 15 h. The decay light curve is consistent with previous models of X-ray novae outbursts.
Key words: X-rays: general / X-rays: binaries / galaxies: groups: individual: M 31
© ESO, 2012
1. Introduction
About one third of the nearly 200 known Galactic X-ray binaries show evidence of being X-ray transient (XRT) sources (Tanaka & Shibazaki 1996). Optical follow up observations, and in particular dynamical mass measurements, of more than 15 XRTs indicate that the mass of the accretor is larger than around ~3 M⊙, indicating they can not be a stable neutron star. The orbital periods of these binaries ranges from 4.1 h to 34 days (Remillard & McClintock 2006a,b). These binaries are thus thought to contain accreting stellar mass black holes. Their time variability and high X-ray luminosity (>1038 erg s-1) are further strong indications that they are powered by black holes (Charles 1998). These systems are thus prime candidates for investigating the physics of accreting black holes.
In comparison to the Galactic sources, extragalactic XRT sources have been relatively little studied. It is only now in the era of Chandra and XMM that it has been possible to systematically monitor other galaxies, and in particular M 31.
There are several important reasons for carrying out such surveys, including having an accurate distance to M 31, which leads to well-determined X-ray luminosities, in contrast with the majority of Galactic XRTs, for which there still exists considerable uncertainty in their distance estimates. Also, the orbital period distribution of X-ray binaries in M 31 can be determined and compared to that in our Galaxy. Finally such surveys can provide a census of black hole systems to compare with the predictions of stellar evolution theory.
The bulge of M 31 is a particularly good target as it can be monitored in its entirety during a single pointing. For these reasons, M 31 has been observed by Chandra approximately once per month since 1999. More than 50 transients have already been reported in the literature based on these surveys of M 31 (Kong et al. 2002; Di Stefano et al. 2004; Williams et al. 2004).
The similarities between the X-ray light curves of XRT and those of dwarf novae suggest that they may be governed by the same processes. Both types of outburst appear to be governed by thermal-viscous instability in the disk (see e.g. Lasota 2001, for a review), that results in two stable phases (hot and cold), and an unstable phase; the disk cycles between outburst (hot phase) and quiescence (cold phase).
The outbursts of the dwarf novae last for a few days and recur every few weeks, whereas the outbursts of XRTs for one month or more, and the recurrence time-scale is years. King & Ritter (1998, hereafter KR98) showed that this difference in time-scales may be explained by the X-ray irradiation occurring in XRTs; the X-ray radiation prevents the disk from returning to the cold state, meaning that more of the disk is emptied; hence the outbursts of XRTs are longer lasting and less frequent. KR98 showed that we may expect the XRT light curve to decay exponentially so long as the whole disk is irradiated; however, when the X-ray flux decreases sufficiently to allow the outer disk to cool (after several decay times), KR98 expect a linear decay. In fact, KR98 expect linear decay throughout the entire outburst for systems where the disk is so big that it is never fully irradiated. Indeed Shahbaz et al. (1998) were able to estimate binary sizes for several XRTs by using the exponential or linear nature of their decay.
It is also possible to constrain the orbital period, knowing the X-ray luminosity and absolute magnitude of a system. van Paradijs & McClintock (1994, hereafter VPM94) found a correlation between X-ray luminosity and optical magnitude.
 where Σ = (Lx/LEdd)1/2(P/1 hr)2/3 and LEdd = 2.5 × 1038 erg s-1. We note, however, that the data used to derive the VPM94 relation are dominated by neutron star systems, and to address this we have re-derived the Mvlog Σ relation for black holes only (for more details see Moss et al., in prep.). Russell et al. (2006) have also investigated the relation between observed OIR fluxes, X-ray/radio emission and spectral state for a large sample of X-ray binaries. In their Fig. 5, they relate the X-ray/optical flux and binary (semi-major) axis for 15 systems in the hard state.
Here we report on observations of CXOM 31 J004253.1+411422, the brightest XRT discovered in M 31. The luminosity of this source is comparable to the most luminous XRTs in our own Galaxy. First discovered by Henze et al. (2009), Kaur et al. (2012) have recently classified this object as a Ultra-Luminous X-ray source with a primary mass of 14 solar masses.
In this paper we present a detailed X-ray light curve of its subsequent return to quiescence using Chandra ACIS-I and Swift observations. We also discuss Hubble Space Telescope (HST) images in which a bright optical counterpart is clearly identified.
Details of the X-ray and optical observations are given in Sect. 2, our results in Sect. 3, and our discussion is presented in Sect. 4. We summarize our conclusions in Sect. 5.
2. Data reduction and analysis
2.1. X-Ray data from Chandra
As part of Chandra’s long term monitoring of M 31, a new source, CXOM 31 J004253.1+411422, was discovered on 17 December 2009. We followed the criteria described by Kong et al. (2002) to give the source the short name r2-75. Initially observed with the Chandra High Resolution Camera (HRC-I), the source’s luminosity of (4.6 ± 0.1) × 1039 erg s-1 was inferred by using a Swift spectrum obtained five days later, normalized to the HRC count rate (Henze et al. 2009).
We have obtained nine X-ray images of the source with the Chandra Advanced CCD Imaging Spectrometer (ACIS) camera. ObsIDs 10719, 11838, 11839, 11840 and 11841 were guaranteed time observations (PI: S. Murray). Anticipating the possible detection of bright transients, an alternating exposure mode was used to reduce the effect of pileup. In this observation mode each sixth frame has 0.6 s of exposure instead of 3.2 s. Details of our Chandra observations are given in Table 1.
Details of our Chandra ACIS-I and Swift observations.
Our first task was to estimate the most accurate position for the new source. By using the IRAF1 task ccmap, the positions of the X-ray sources with known globular cluster counterparts were aligned with the globular cluster centers in the Local Group Survey images (LGS; Massey et al. 2006). This allows for adjustments of the pixel scale as well as rotation and shifts in X and Y. The final corrected position of r2-75 is RA = 00:42:53.2 ± 0.01, Dec = +41:14:22.6 ± 0.1 in J2000. This position is consistent with that found by Kaur et al. (2012) after including the errors in matching to the 2MASS coordinate system used there.
Since the source is so bright, we immediately checked the ACIS-I data for the effects of pileup by generating a pileup map for each observation with the CIAO task pileup_map2. Any value of the count rate per frame ≥ 0.2 indicates pileup (for more information see the table and the document provided in the above link). It is clear from these maps that three ACIS observations, ObsIDs 10719, 11277 and 11278, were piled up. In Table 2 we provide a summary of the count rate per frame on the pileup maps for the short (0.6 s) and the longer (3.2 s) frame times for each ACIS observation.
We extracted the X-ray spectrum of the source from each of the ACIS images using the CIAO task psextract3. We binned each spectrum in energy so that each bin contained ≳ 10 counts to allow for standard χ2 statistics. Using XSPEC, we fitted absorbed power law and absorbed disk black body models, in addition to a pile-up model4, where appropriate. The pileup model is implemented in XSPEC by the algorithm described by Davis (2001). We assumed the grade morphing parameter (denoted by α in the pileup model) is 0.5, which is the value suggested in the CIAO documentation5. We fitted a pileup model (with frozen α = 0.5) and a disk black body model to the shorter exposure time data, taken with the alternating readout mode.
The pileup during ObsId 10719 was so severe that not even the spectrum constructed from 0.6 s exposures was usable. Indeed, the count rate per frame for this observation is smaller for the 3.2 s exposures than the 0.6 s exposure; hence, the pileup was so severe that most photons were rejected. Furthermore, r2-75 fell between chips during observations 11279 and 11840. We removed all three observations from our sample.
Count rate per frame on the pileup map from each ACIS observation.
The results are discussed in Sect. 4 and summarised in Table 3.
2.2. X-ray data from Swift
Seven observations of r2-75 were made with Swift during 2010 June, taken at three-day intervals. Unfortunately, the 2010 June 21 observation had an exposure time of just 25 s, so this observation was ignored. Details of Swift observations are given in Table 1.
We expect significant pile-up at around 0.7 counts-1 for the XRT in pc mode (Moretti et al. 2005). We checked our Swift observations for pile-up using the method recommended by the Swift team; this involved comparing the radial profile of r2-75 with a King function ![Mathematical equation: \begin{equation} {\it PSF}\left(r\right) = \left[1 + \left(r/r_{\rm c}\right)^2 \right]^{-\beta} \end{equation}](/articles/aa/full_html/2012/06/aa18109-11/aa18109-11-eq20.png) (1)where rc and β for a Swift source free from pileup are aproximately 5.8 and 1.55, respectively. The radial profile of r2-75 was well described by the King function, with no sign of the under-luminous core that signifies pileup. We therefore conclude that r2-75 was free from significant pileup in all of the Swift observations.
(1)where rc and β for a Swift source free from pileup are aproximately 5.8 and 1.55, respectively. The radial profile of r2-75 was well described by the King function, with no sign of the under-luminous core that signifies pileup. We therefore conclude that r2-75 was free from significant pileup in all of the Swift observations.
The data were analyzed with xselect version 2.4a. We used the recommended source extraction radius of 47′′ as this contains around 90% of the source photons. We also extracted background data from a similarly sized, nearby region of blank sky. The light curves of each Swift observation were consistent with constant intensity. Spectra of bright observations were analyzed with XSPEC version 12.6, with a grouping that yielded a minimum of 20 photons per bin.
2.3. Optical
As part of our program to find optical counterparts to bright M 31 XRTs, we obtained HST/ACS data at the position of the new transient, during its outburst, on 21-Jan.-2010, and once again when the source returned to quiescence on 20-Jul.-2010. Our observations were taken using the standard ACS box 4-point dither pattern to recover the highest possible spatial resolution. Both of these observations were obtained with the F435W filter.
We used PyRAF6 task multidrizzle7, to generate our images, yielding an image of resolution 0.025′′ pixel-1. The task also removes cosmic ray events and geometric distortions, whilst combining the dithered frames together into one final image.
We aligned all of the HST images to the LGS coordinate system with ccmap using stars common to both data sets. The resulting alignment had rms errors of 0.04′′ (less than 1 ACS pixel).
3. Results
3.1. X-ray
Spectral fits and unabsorbed 0.2–10.0 keV luminosities of r2-75.
The upper limit from our Chandra observation taken on 2009 Dec. 08 (ObsID 11276) is <0.17 × 1037 erg s-1. We calculated the upper limits by assuming a power law spectrum of photon index 1.7 and a hydrogen column NH = 6 × 1020 cm-2. In addition, we combined 55 Chandra ACIS observations of this field yielding an image with a net ACIS exposure of 240 ks. The 3σ upper limit from this merged image is 9.6 × 10⁻⁵ cts/s, corresponding to an intrinsic 0.2–10.0 keV luminosity of 1 × 1035 erg s-1, assuming the above values for the photon index and hydrogen column density. The column we have used for these fits, 6 × 1020 cm-2, is the Galactic foreground absorption value towards M 31, consistent with our best estimate of the column towards r2-75 obtained on 2009 Dec. 22. We fixed the column to this value for all the other spectral fits described in what follows.
The first two Swift observations after the outburst, in 2009 December (ObsID 00031518013) and 2010 January (ObsID 00031518014), are well described by a disk black body model, with χ2/d.o.f. < 1.
For the two first Chandra observations (ObsIDs 11277 and 11278), freezing NH and fitting the pileup model and a disk black body model on the shorter frame time observations gave more reasonable results than for the longer frame time observations.
The best disk black body fit to the 2010 February data (ObsID 00031518015) yields χ2/d.o.f. = 51/39; this is an acceptable fit, but it systematically underestimates the high energy spectrum. Therefore, we added a power law component to represent unsaturated inverse comptonization of cool photons on hot electrons in the accretion disk corona. The best fit yielded χ2/d.o.f. = 31/37; F-testing showed that this improvement was significant at the 99.99% level, hence we adopted this model. This evolution is expected for black hole transients going from the high state to the intermediate state during the decay of the outburst.
Fitting a power law model to our next ACIS observation (ObsIDs 11838) gave more reasonable result than a disk black body model.
For the 2010 June Swift observations, there were too few photons for reliable spectral fitting; for these observations, we converted from intensity to source flux using an assumed model. We determined the best model to use by simultaneously fitting spectra from the 27 May 2010 Chandra (ObsID 11838) observation and the 6 June 2010 Swift observation (ObsID 00031255013). Results from this simultaneous fit had smaller uncertainties relative to those obtained from a fit to the Chandra spectrum alone. The best fit was an absorbed power law with NH frozen at 6 × 1020 cm-2 and Γ = 2.5 ± 0.2, yielding χ2/d.o.f. = 23/21; such a spectrum is consistent with a black hole transient entering the low/hard state as the outburst decays. We fitted a power law model to our last Chandra observation (ObsId 11839).
To estimate the X-ray upper limit for r2-75 when it had returned to quiescence on 24-Aug.-2010 (ObsID 11841), we used the CIAO task aprat8, and set the conf parameter to 0.99. To convert this 3-σ upper limit to a flux, we assumed a power law spectrum with Γ = 1.7 and NH = 6 × 1020 cm-2 to generate the limit reported in Table 3.
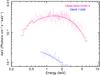 |
Fig. 1 Spectrum of r2-75 from the first Swift observation (ObsId 0031518013), compared to the Chandra observation obtained 150 days later (ObsId 11838). The best fit spectrum to the former is a disk black body model, whereas for the later, the preferred model is that of a power law. |
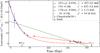 |
Fig. 2 X-ray light curve of r2-75. Simple exponential or linear models do not fit the data (χν are around 30 and 60 respectively). A better fit instead is a combined model consisting of an initially exponential decay followed by a longer, linear phase. These models are not only better fits, but are also consistent with the results of Shahbaz et al. (1998). The origin of the graph, in time, corresponds to first Swift observation. |
A summary of our Chandra and Swift spectroscopic results are given in Table 3. The change in the spectrum of r2-75, is also shown in Fig. 1 by comparing our first Swift observation (ObsId 00031518013) and (ObsId 11838). To calculate the error bars for the unabsorbed luminosity, we assumed the percentage error is the same for the absorbed and unabsorbed flux. The X-ray luminosity is computed using a distance to M 31 of 780 kpc (Holland 1998).
Figure 2 shows our derived 0.2–10 keV X-ray light curve. Unfortunately, we do not have points between 80 to 160 days after the outburst, so we assumed it to be a single-peaked light curve. Next we divided our data points into two groups, one consisting of data points fitted with a disk black body model and the other of data points fitted with a disk black body+power law or a power law model only. The best fit curve to the first group appears to be initially exponential, whereas a linear decay best fits the second. Such behavior is consistent with the expectations of KR98.
The results of KR98 suggest that the the decay constant should increase with orbital period, but saturate at about 40 days for periods >24 h. Since the decay time for r2-75 looks to be about 25 days, we expect the orbital period to be significantly shorter than a day.
3.2. Optical
Comparing the images obtained during and after the outburst revealed a candidate optical counterpart within the Chandra X-ray error circle. The observed images and the subtracted image are shown in Fig. 3.
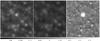 |
Fig. 3 HST observations of r2-75. The green circles show the uncertainty in the position of r2-75. Left to right: image during outburst (Jan. 2010, filter 435W), quiescence (Jul. 2010, filter 435W) and the subtracted image. |
By using PHOT9, we measured the magnitude of the optical counterpart to be 23.91 ± 0.08 in the B band. As we will see (see Sect. 4) it will be useful to convert the B band measurement to the absolute V band magnitude. To do this we assumed the distance modulus to M 31 equals 24.47, the optical extinction is AB = 0.44 (Predehl & Schmitt 1995) and took the mean B − V color of low mass X-ray binaries (LMXBs) to be 0.09 ± 0.14 (Liu et al. 2001). From this we obtain MV = −0.91 ± 0.16.
The July 2010 HST “off” observation yields an upper limit of MB > 24.2.
3.3. Orbital period
To use VPM94 relation, we combine our HST observations with the Swift observation (ObsID 00031518014) obtained only 6 days afterwards. These two measurements yield Lx = 50 × 1037 erg s-1, and MV = −0.91 ± 0.16, from which we estimate  days (excluding the errors in the relation). Note, however, that although some of the X-ray fluxes used in the VPM94 relation were measured in the 2–10 keV range, rather than the 0.5–10 keV range of our measurement, we have not attempted to correct for this.
As only two of the sources used to derive VPM94 relation were black hole, we next obtained data from a sample of transient Galactic black holes near the maximum of their outburst, for which optical observations were also available, supplemented by a smaller number of persistently bright systems. These data yield
 This relationship has been obtained for systems exclusively in the high soft (thermal) state, in the 2–10 keV energy range. This was motivated by the fact that our Swift spectroscopy (see Table 3) suggests that r2-75 was in this state during our contemporaneous HST/Chandra measurements. Correcting our 0.5–10 keV flux for r2-75 to the 2–10 keV range indicates a shorter orbital period of
  h. The error includes those in the relationship above, and that due to the uncertainty in Mv.
Using the Russell et al. (2006) analysis, we estimate a shorter orbital period for r2-75 of 1.75 h.
4. Discussion
We favor a period about 15 h over the shorter estimate of 1.75 h for two reasons. Firstly, whilst the former is based on the Mv versus log (Σ) relation for sources in the soft state, the latter is strictly applicable to sources in the hard state only. As we have seen, r2-75 was in the soft state during our contiguous HST/Chandra measurements. Secondly, the structure of the secondary is highly constrained under the assumption of Roche-lobe filling geometry, such that the average density is solely determined by the orbital period (i.e., Eq. (4.8) of Frank et al. 1992). The actual densities of known secondaries in Galactic black hole X-ray novae run from about 6.7 g/cm3 to < 1 g/cm3 for the longer period systems (see Table 5.3 of Charles & Coe 2006). Given the estimated primary mass of 14 M⊙ (Kaur et al. 2012) a 1.75 h period for r2-75 implies a density of 28 g/cm3 for even the smallest secondary seen in the Galaxy (XTE J1118+480, at M2 = 0.25 M⊙). Similarly, a period of 4 h would imply a density of 7 g/cm3, which while possibly reasonable implies a mass ratio of 56, which is out of line with what is seen in the Galaxy. For this reason too we favor our longer period over the 1.75 h estimate.
5. Conclusion
We have studied CXOM 31 J004253.1+411422, a very bright transient in M 31, with designated name r2-75. The transient was active for half a year.
Follow-up HST/ACS observations reveal an optical counterpart. This counterpart decayed from B = 23.91 ± 0.08 to B > 24.2 in our HST observations, taken six months apart. This implies that r2-75 is most likely a LMXB.
Using an improved empirical relation between Mv, Lx and Porb for LMXBs, we estimate an orbital period for r2-75 of about ~15 h.
We have measured the decay light-curve of r2-75 using Chandra and Swift observations. The decay appears to be exponential initially, and then changes to linear. This change is accompanied by a change in the spectrum from a disk black body to a spectrum requiring a power law component. Both changes are as expected from the models of King & Ritter (1998).
IRAF is distributed by the National Optical Astronomy Observatory, which is operated by the Association of Universities for Research in Astronomy, Inc., under cooperative agreement with the National Science Foundation.
PyRAF is a product of the Space Telescope Science Institute, which is operated by AURA for NASA.
Multidrizzle is a product of the Space Telescope Science Institute, which is operated by AURA for NASA. http://stsdas.stsci.edu/multidrizzle
References
- Charles, P. 1998, in Theory of Black Hole Accretion Disks, ed. M. A. Abramowicz, G. Bjornsson, & J. E. Pringle, 1 [Google Scholar]
- Charles, P. A., & Coe, M. J. 2006, Optical, ultraviolet and infrared observations of X-ray binaries, ed. W. H. G. Lewin, & M. van der Klis, 215 [Google Scholar]
- Davis, J. E. 2001, ApJ, 562, 575 [NASA ADS] [CrossRef] [Google Scholar]
- Di Stefano, R., Kong, A. K. H., Greiner, J., et al. 2004, ApJ, 610, 247 [NASA ADS] [CrossRef] [Google Scholar]
- Frank, J., King, A., & Raine, D. 1992, Accretion power in astrophysics [Google Scholar]
- Henze, M., Pietsch, W., Haberl, F., & Greiner, J. 2009, The Astronomer’s Telegram, 2356, 1 [Google Scholar]
- Holland, S. 1998, AJ, 115, 1916 [NASA ADS] [CrossRef] [Google Scholar]
- Kaur, A., Henze, M., Haberl, F., et al. 2012, A&A, 538, A49 [NASA ADS] [CrossRef] [EDP Sciences] [Google Scholar]
- King, A. R., & Ritter, H. 1998, MNRAS, 293, L42 [NASA ADS] [CrossRef] [Google Scholar]
- Kong, A. K. H., Garcia, M. R., Primini, F. A., et al. 2002, ApJ, 577, 738 [NASA ADS] [CrossRef] [Google Scholar]
- Lasota, J.-P. 2001, New Astron. Rev., 45, 449 [NASA ADS] [CrossRef] [Google Scholar]
- Liu, Q. Z., van Paradijs, J., & van den Heuvel, E. P. J. 2001, A&A, 368, 1021 [NASA ADS] [CrossRef] [EDP Sciences] [Google Scholar]
- Massey, P., Olsen, K. A. G., Hodge, P. W., et al. 2006, AJ, 131, 2478 [NASA ADS] [CrossRef] [Google Scholar]
- Moretti, A., Campana, S., Mineo, T., et al. 2005, in SPIE Conf. 5898, ed. O. H. W. Siegmund, 360 [Google Scholar]
- Predehl, P., & Schmitt, J. H. M. M. 1995, A&A, 293, 889 [NASA ADS] [Google Scholar]
- Remillard, R. A., & McClintock, J. E. 2006a, Compact stellar X-ray Sources (Cambridge University Press) [Google Scholar]
- Remillard, R. A., & McClintock, J. E. 2006b, ARA&A, 44, 49 [NASA ADS] [CrossRef] [Google Scholar]
- Russell, D. M., Fender, R. P., Hynes, R. I., et al. 2006, MNRAS, 371, 1334 [NASA ADS] [CrossRef] [Google Scholar]
- Shahbaz, T., Charles, P. A., & King, A. R. 1998, MNRAS, 301, 382 [NASA ADS] [CrossRef] [Google Scholar]
- Tanaka, Y., & Shibazaki, N. 1996, ARA&A, 34, 607 [NASA ADS] [CrossRef] [Google Scholar]
- van Paradijs, J., & McClintock, J. E. 1994, A&A, 290, 133 [NASA ADS] [Google Scholar]
- Williams, B. F., Garcia, M. R., Kong, A. K. H., et al. 2004, ApJ, 609, 735 [NASA ADS] [CrossRef] [Google Scholar]
All Tables
All Figures
|
Fig. 1 Spectrum of r2-75 from the first Swift observation (ObsId 0031518013), compared to the Chandra observation obtained 150 days later (ObsId 11838). The best fit spectrum to the former is a disk black body model, whereas for the later, the preferred model is that of a power law. |
| In the text | |
|
Fig. 2 X-ray light curve of r2-75. Simple exponential or linear models do not fit the data (χν are around 30 and 60 respectively). A better fit instead is a combined model consisting of an initially exponential decay followed by a longer, linear phase. These models are not only better fits, but are also consistent with the results of Shahbaz et al. (1998). The origin of the graph, in time, corresponds to first Swift observation. |
| In the text | |
|
Fig. 3 HST observations of r2-75. The green circles show the uncertainty in the position of r2-75. Left to right: image during outburst (Jan. 2010, filter 435W), quiescence (Jul. 2010, filter 435W) and the subtracted image. |
| In the text | |
Current usage metrics show cumulative count of Article Views (full-text article views including HTML views, PDF and ePub downloads, according to the available data) and Abstracts Views on Vision4Press platform.
Data correspond to usage on the plateform after 2015. The current usage metrics is available 48-96 hours after online publication and is updated daily on week days.
Initial download of the metrics may take a while.