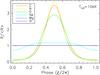
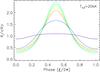
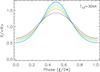
Fig. 5
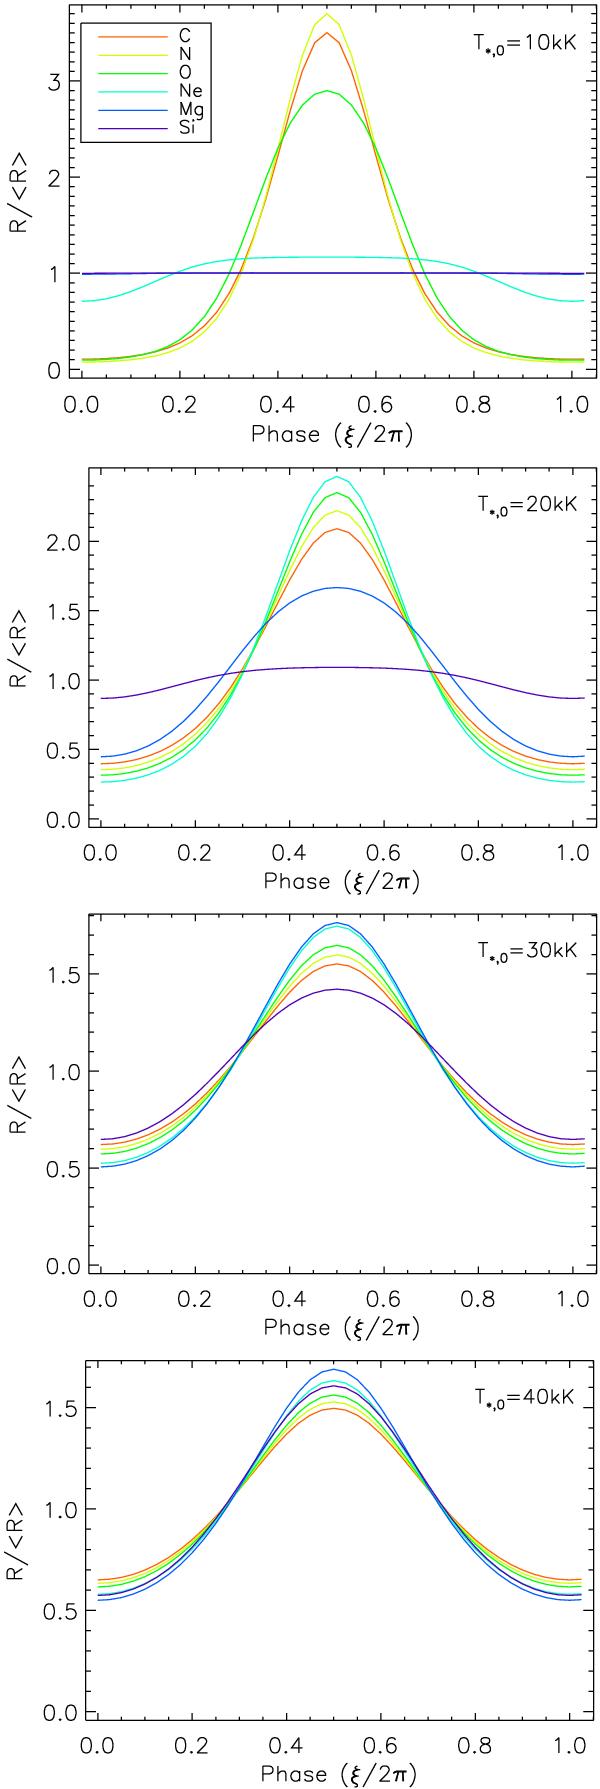
Variation in ratio R / ⟨R⟩ for each of the six helium-like ions, C v (red); N vi (yellow); O vii (green); Ne ix (teal); Mg xi (blue); and Si xiii (purple), for our model for a star with average effective temperatures 10 000, 20 000, 30 000 and 40 000 K (top to bottom). Note that the absolute scale of variation changes dramatically – see the values of R0 and ⟨R⟩ for each ion in Table 3. This figure shows the differences in the width and height of the peaks and troughs in the periodic variation of the ratio.

Current usage metrics show cumulative count of Article Views (full-text article views including HTML views, PDF and ePub downloads, according to the available data) and Abstracts Views on Vision4Press platform.
Data correspond to usage on the plateform after 2015. The current usage metrics is available 48-96 hours after online publication and is updated daily on week days.
Initial download of the metrics may take a while.