Fig. 7
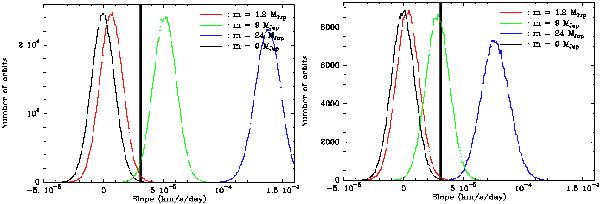
Plots of the statistical distribution of the simulated radial velocity slope using the model developed in Chauvin et al. (2012), for three different masses: 1.2 MJup (red line), 9 MJup (green line) and 24 MJup (blue line) and semi-major axis in the range 8.5 − 8.5 AU (left) and 11.5 − 12.5 AU (right). The vertical grey/black bar shows the measured slope value, which is also the 3σ upper limit of the slope.
Current usage metrics show cumulative count of Article Views (full-text article views including HTML views, PDF and ePub downloads, according to the available data) and Abstracts Views on Vision4Press platform.
Data correspond to usage on the plateform after 2015. The current usage metrics is available 48-96 hours after online publication and is updated daily on week days.
Initial download of the metrics may take a while.