Fig. 2
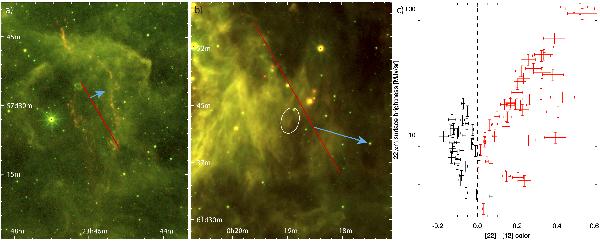
a) WISE two-color composite – red: 22 μm, green: 12 μm. The red line marks the extend and position of this echoing region as previously reported in scattered light by Rest et al. (2008). This region is referenced with “O” in Table 1. b) Most distant infrared echo from Cas A at a distance ~800 pc. The red line marks the location of the previously observed scattered light echo as reported in Rest et al. (2008), while the cyan arrow marks the direction towards Cas A. This region is referenced with “T” in Table 1. c) Color-brightness diagram of echo regions (red data points) and selected cirrus regions (black data points). The [22]–[12] color is defined as log 10(F22/F12). Errors mainly arise from uncertainties in background subtraction and flux calibration. All infrared echoes are characterized with flux ratios >1.0 (corresponding to a color of 0.0).
Current usage metrics show cumulative count of Article Views (full-text article views including HTML views, PDF and ePub downloads, according to the available data) and Abstracts Views on Vision4Press platform.
Data correspond to usage on the plateform after 2015. The current usage metrics is available 48-96 hours after online publication and is updated daily on week days.
Initial download of the metrics may take a while.