| Issue |
A&A
Volume 541, May 2012
|
|
|---|---|---|
| Article Number | L4 | |
| Number of page(s) | 4 | |
| Section | Letters | |
| DOI | https://doi.org/10.1051/0004-6361/201219036 | |
| Published online | 18 April 2012 | |
Quantifying the coherent outflows of galaxies around voids in the SDSS DR7
1 IANIGLA-CONICET, Parque Gral San
Martín, CC 330, 5500 Mendoza,
Argentina
e-mail: This email address is being protected from spambots. You need JavaScript enabled to view it.
2 Instituto de Astrofísica de
Canarias, c/ Via Láctea
s/n, 38200
Tenerife,
Spain
3 Departamento de Astrofísica,
Universidad de La Laguna, 38205
Tenerife,
Spain
4 Campus of International Excellence
UAM/CSIC, Cantoblanco, 28049
Madrid,
Spain
5 Instituto de Física Teórica,
UAM/CSIC, Universidad Autónoma de Madrid, Cantoblanco, 28049
Madrid,
Spain
6 Instituto de Astrofísica de
Andalucía (CSIC), Glorieta de la
Astronomía, 18008
Granada,
Spain
Received:
14
February
2012
Accepted:
26
March
2012
Abstract
We report the detection, with a high level of confidence, of coherent outflows around voids found in the seventh data release of the Sloan Digital Sky Survey (SDSS DR7). In particular, we developed a robust ⟨|cos θ|⟩ statistical test to quantify the strength of redshift-space distortions (RSD) associated with extended coherent velocity fields. We consistently find that the vector that joins void centers with galaxies that lie in shells around them is more likely to be perpendicular to the line-of-sight than parallel to it. This effect is clear evidence for the existence of outflows in the vicinity of voids. We show that the RSD exist for a wide range of void radius and shell thickness, but they are more evident in the largest voids in our sample. For instance, we find that the ⟨|cos θ|⟩ for galaxies located in shells within 2 h-1Mpc from the edge of voids larger than 15 h-1Mpc deviates 3.81σ from uniformity. The measurements presented in this work provide useful information to constrain cosmological parameters, in particular Ωm and σ8.
Key words: cosmology: observations / large-scale structure of Universe / galaxies: statistics / methods: statistical
© ESO, 2012
1. Introduction
According to the cosmological principle, the clustering of galaxies is statistically isotropic. In actual galaxy redshift surveys, anisotropies arise because distances to galaxies are obtained from redshifts (i.e. Hubble flow plus peculiar velocities), making the line-of-sight a preferred direction. These so-called redshift-space distortions (RSD) pose a problem to several large-scale structure (LSS) studies, especially those that rely on the 3-d positions of galaxies (see Hamilton 1998 for a comprehensive review of the effect). Yet, RSD provide valuable information about cosmological parameters, in particular the matter density parameter Ωm and the normalization of the amplitude of density fluctuations σ8 (e.g. Kaiser 1987; Cole et al. 1994; Tinker et al. 2006; Percival & White 2009; Ross et al. 2011). The RSD studies have improved considerably since early galaxy surveys thanks to measurements made in recent large-scale surveys both from the analysis of the galaxy correlation functions (Peacock et al. 2001; Hawkins et al. 2003 using the 2dFGRS and Zehavi et al. 2005; Okumura et al. 2008; Cabré & Gaztañaga 2009 in the SDSS) and power spectrum (Percival et al. 2004 in the 2dFGRS). These measurements have also been extended to higher redshift (Guzzo et al. 2008; Blake et al. 2010). However, it is still debated which the best RSD estimator is for extracting cosmological information (see Percival & White 2009 for a review of this topic).
A particularly interesting case for observing and quantifying RSD associated with extended coherent velocity fields may be provided by large cosmic voids in the distribution of galaxies. These regions in the LSS have, on average, a very low enclosed matter density (δ ≡ ρ(<Rvoid) − ρmean)/ρmean ≃ −0.9, e.g. Gottlöber et al. 2003; Patiri et al. 2006a), which generates a well-defined spherically averaged radial outflow in the matter (and galaxy) velocity field (e.g. Padilla et al. 2005; Ceccarelli et al. 2006; Patiri et al. 2006b). As a consequence, the average density contours around large voids that are nearly spherical in real space will appear as ellipsoids elongated along the line-of-sight in redshift space. That is, galaxies mapped in actual redshift surveys that are located in spherical shells around voids are more likely to have a position vector perpendicular to the line-of-sight than parallel to it. Quantifying this effect provides a powerful statistic to assess the strength of RSD. Moreover, a key advantage of studying RSD around large voids is that the strength of the effect can be computed efficiently for a given power spectrum using an existing theoretical framework (Patiri et al. 2006a; Betancort-Rijo et al. 2009), which is essential to establish strong constraints to cosmological parameters.
In this paper, we use a sample of galaxies located in the vicinity of large voids drawn from the SDSS DR7 to study redshift-space distortions. To quantify RSD, we employed a modified form of a particularly simple, yet robust method: the ⟨|cos θ|⟩ statistics, i.e. the averaged absolute value of the cosine of the angle, θ, between the position vector of galaxies within shells around voids and the line-of-sight to the center of their corresponding void. This provides a clear, powerful statistic to assess the strength of RSD.
The paper is organized as follows. In Sect. 2 we present the data and sample selection. In Sect. 3 we describe the statistical test and show our results, and finally in Sect. 4 we discuss the results and future work.
2. Data and sample selection
We used the NYU Value-Added Galaxy Catalog (NYU-VAGC1, Blanton et al. 2005) associated to the Sloan Digital Sky Survey Data Release Seven (SDSS DR7, Abazajian et al. 2009), which is the final data release for the SDSS-II. The full catalog includes redshifts of ~700 000 main sample galaxies covering ~8000 deg2 on the sky. From this catalog, we extracted a volume-limited sample defined by a r-band absolute magnitude threshold Mr − 5log h = −20.3 and a maximum redshift of z = 0.13, which resulted in a sample with a total of 162 076 galaxies. Note that all galaxies are k-corrected to redshift z = 0.1 (approx. the median redshift of the survey, see Blanton et al. 2003).
We assumed a flat ΛCDM cosmology with parameters consistent with the latest WMAP-7 results (Jarosik et al. 2011). We converted galaxy redshifts to proper comoving distances using the standard equation (Hogg 1999)  (1)with Ωm = 0.267 and ΩΛ = 0.733. We write the Hubble constant H0 in terms of the dimensionless Hubble parameter h, i.e. H0 = 100 h. We checked that galaxies are uniformly distributed within the sample applying a standard Vmax test.
In this work, we define voids as maximal spheres empty of galaxies brighter than the limiting magnitude of our galaxy sample defined above. To search for voids in the galaxy sample, we used the HB void finder. We refer the reader to Patiri et al. (2006b) for details about the void-finding methodology and algorithm. In Table 1 we present the statistics of voids found in our volume-limited galaxy sample.
Here, we are interested in the galaxies located in the boundaries of voids. In particular, we searched for all galaxies located in shells of a given width around the edges of the voids. Then, we computed the angle, θ, between the position vector of the galaxy (with respect to the center of the void) and the position of the center of the void as follows  (2)where s is the position vector of the galaxy with respect to the center of the void, and r is the position vector of the center of the void with respect to the observer.
Complete statistics of large voids found in our volume-limited galaxy sample extracted from the SDSS DR7.
Summary of our results.
3. Statistical test and results
In principle, variations of standard methods, such as the void-galaxy correlation function (see e.g. Padilla et al. 2005) can be used to detect and quantify RSD around voids. However, in the largest currently available galaxy survey such as the SDSS, the number of voids and galaxies in their vicinity are not sufficient to obtain sharp density contours and consequently reliable statistics necessary to extract inferences for the relevant cosmological parameters. As mentioned above, we developed a modified version of the widely used ⟨|cos θ|⟩ statistical test.
The standard way to construct a ⟨|cos θ|⟩ test would be to simply calculate the average of |cos θ| over all galaxies in the sample located in the relevant shells of a given width around the edges of the voids. However, because of the correlations between the galaxies within a shell of a given void, the corresponding cosine values are not independent random variables. This hinders assessing the statistical significance of the test. For instance, those correlations may cause the rms to increase considerably from the standard  rms (where Ng is the total number of galaxies in the void shells) obtained if galaxies were uncorrelated.
We constructed a modified version of the standard average of the |cos θ| test in the following way  (3)where ⟨|cos θ|⟩i is the average of |cos θ| over all galaxies in the relevant shell of the ith void and NV is the total number of voids in our sample.
In this procedure, galaxies located in the shell of a given void are distributed independently for different voids, so they can be treated effectively as an independent random variable. To estimate the rms of our statistic we used the independence of all terms of the sum in the r.h.s. of Eq. (3), so the variance of our statistic is given by ![Mathematical equation: \begin{eqnarray} {\rm rms}(\langle\!\langle|{\rm cos}~ \theta|\rangle\!\rangle)^{2} = \frac{1}{N_{V}} \left[\frac{\left(\sum_{i=1}^{N_{V}} \langle|{\rm cos}~ \theta|\rangle^{2}_{i}\right)}{N_{V}}-\langle\!\langle|{\rm cos}~ \theta|\rangle\!\rangle^{2}\right]. \end{eqnarray}](/articles/aa/full_html/2012/05/aa19036-12/aa19036-12-eq57.png) (4)Once we obtained the rms we computed the statistical significance (i.e. giving the confidence level at which the null-hypothesis may be rejected) written as the number of sigmas, Nσ, in the following way
(4)Once we obtained the rms we computed the statistical significance (i.e. giving the confidence level at which the null-hypothesis may be rejected) written as the number of sigmas, Nσ, in the following way  (5)It is worth noting that this is a conservative approach. In principle, it should be possible to construct a more efficient statistical test. This task, however, is not simple to carry out since the sampling errors of that estimate are difficult to treat. We will address these issues in detail in a future work.
In Table 2 we present the results for the ⟨⟨|cos θ|⟩⟩ statistic and its respective significance. We show the results obtained for several shell sizes and void radii. In absence of redshift distortions, i.e. when the redshift space coincides with real space, the average value of the absolute value of cos θ must be 0.5.
We double-checked this by placing random spheres over the galaxy sample and calculating the angles for the galaxies found in the shells of the random spheres following Eq. (3). In particular, we made 100 different realizations of NV random spheres, where NV is the number of actual voids larger than a given radius. We then calculated the standard average and rms of the 100 realizations. We show these results also in Table 2 (Cols. 6 and 7). Note the similarity between the rms values shown in Cols. 3 and 7. This reflects the fact that the corresponding settings, i.e. the number and correlations of galaxies in the shells of voids and the random spheres, are rather similar. Also, because the values of ⟨|cos θ|⟩ for the random spheres are 0.5 (within the rms) possible biases caused by border effects or by not using the “correct” cosmological parameters in Eq. (1) can be excluded.
For the wide range of void radii and shell sizes considered, the statistic generally shows values of ⟨⟨|cos θ|⟩⟩ consistently lower than 0.5. This departure of the distribution of ⟨⟨|cos θ|⟩⟩ from uniformity is a clear signal of RSD generated by the underdensity associated with the voids. The effect is a unique function of the value of the enclosed fractional density contrast (δ) within the average radius of the galaxies within the shell, and does not depend directly on the value of that radius. Moreover, the largest deviations appear for the largest voids in our sample. This is not surprising because the average underdensity within voids increases with the radius of the void (see e.g. Patiri et al. 2006a), and as mentioned above, if the enclosed density within voids decreases, the radial outflows will be stronger.
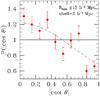 |
Fig. 1 Probability distribution of |cos θ| for voids larger than 15 h-1Mpc and galaxies located in shells of 2 h-1Mpc (filled circles). The full flat line indicates the distribution for isotropy. The dashed line is a theoretical prediction, see text for details. |
On the other hand, the effect is more pronounced for the smaller shell sizes. This trend can be interpreted by checking the profiles of the enclosed density inside and around the voids. Several works (e.g. Gottlöber et al. 2003; Patiri et al. 2006b; Ceccarelli et al. 2006) showed that the void density profiles are monotonically increasing. Consequently, for a given sample of void radii the effect must be monotonically decreasing (safe for statistical fluctuations) as the width of the shell increases. We obtain, in general, considerable values for Nσ both for large and smaller voids, but the largest sigma is found for galaxies in shells of 2.0 h-1Mpc of voids larger than 15.0 h-1Mpc.
To show our results in a more intuitive way, we use an anisotropy parameter, p, defined by  (6)Within this parameterization, p values lower than 1 mean that the vectors s and r tend to be parallel, while for p values higher than 1 the vectors tend to be perpendicular. p = 1 means compatible with isotropy. We also show the values of p for the cases considered above in Table 2, showing more patently the trends seen with the ⟨⟨|cos θ|⟩⟩ test.
It is also interesting to analyze the probability distribution of the |cos θ| values, defined as P(|cos θ|) (hereafter P, for brevity). If there are no distortions, P must be flat, equal to 1. In Fig. 1 we show as an example the P distribution for voids larger than 15 h-1Mpc and galaxies within shells of 2 h-1Mpc (filled circles). We can clearly see that the distribution has a declining trend, incompatible with isotropy. In recent theoretical works (Cuesta et al. 2008; Betancort-Rijo & Trujillo 2009), it has been shown that a general probability distribution for quadrupolar distortions is adequately described by the following equation:  (7)where p is the anisotropy parameter defined in Eq. (6). We also show in Fig. 1 the predicted probability distribution (dashed line) for the case studied above, i.e. with p = 1.218, which agrees well with the observational results.
4. Discussion and conclusions
Our results show clear evidence for the existence of outflows in the vicinity of large cosmic voids found in the SDSS DR7. Because ⟨⟨|cos θ|⟩⟩ is smaller than 0.5 for the wide range of void radii and shell sizes computed in our sample of galaxies and voids, the vector that joins the galaxies located in the shells around voids with the centers of those voids is more likely to be perpendicular to the line-of-sight than in a random distribution. This effect is understood by means of redshift-space distortions: in redshift space, our spherical shells intersect higher density isocontours in the direction perpendicular to the line-of-sight (recall that a sphere in real space is elongated along the line-of-sight due to redshift distortions). Furthermore, the effect increases for void with larger radius (for a given shell width), while for a fixed void radius it decreases for a broader shell width.
We may interpret this in terms of the relationship between the deformation of the density contour, T, and the underlying density contrast, δ, which can be written as follows  (8)where D and a are the growth and scale factors, respectively, H0 is the Hubble constant and f(δ) is a certain function of the enclosed fractional density fluctuation δ within the radius R (Sheth & Tormen 2002; Betancort-Rijo et al. 2006). This function monotonically decreases with the absolute value of δ. Therefore, for a fixed shell width, the effect is more significant for larger voids (since they have higher values of δ). For a fixed void radius, the effect is roughly proportional to f(δ), with δ equal to the enclosed fractional density fluctuation within the mean radius of the shell. Thus, as the shell width increases, the effect decreases since the average value of |δ| will be lower.
In a forthcoming paper, we will explore in detail the model predictions for the magnitude of the effect of redshift distortions around voids as a function of cosmological parameters. For this we will use the analytical framework presented in Patiri et al. (2006a) and extended in Betancort-Rijo et al. (2009). In particular, we will study the dependence of the p parameter with Ωm and σ8. The dependence with Ωm enters through dlnD/dlna (roughly proportional to  ) and also via Γ ≡ Ωmh, which characterizes the shape of the power spectrum. The dependence on σ8 is the result of the higher amplitude of the power spectrum,
which makes large density fluctuations more likely, which in turn increases the value of |δ|.
Acknowledgments
We thank Ignacio Trujillo and Jordi Miralda-Escudé for encouraging discussions. We would also like to thank the referee, whose comments helped to greatly improve the original manuscript. S.G.P. is supported by CONICET grant PIP-11420-0148 and by the Agencia de Promoción Científica y tecnológica (FONCYT) under contract PICT-2010-2397. F.P. acknowledges support by MICINN grants AYA2010-21231-C02-01, the MultiDark Consolider-Ingenio Program CSD2009-00064 and the Campus of International Excellence UAM+CSIC. Funding for the SDSS and SDSS-II has been provided by the Alfred P. Sloan Foundation, the Participating Institutions, the National Science Foundation, the US Department of Energy, the National Aeronautics and Space Administration, the Japanese Monbukagakusho, the Max Planck Society, and the Higher Education Funding Council for England. The SDSS Web Site is http://www.sdss.org/. The SDSS is managed by the Astrophysical Research Consortium for the Participating Institutions. The Participating Institutions are the American Museum of Natural History, Astrophysical Institute Potsdam, University of Basel, University of Cambridge, Case Western Reserve University, University of Chicago, Drexel University, Fermilab, the Institute for Advanced Study, the Japan Participation Group, Johns Hopkins University, the Joint Institute for Nuclear Astrophysics, the Kavli Institute for Particle Astrophysics and Cosmology, the Korean Scientist Group, the Chinese Academy of Sciences (LAMOST), Los Alamos National Laboratory, the Max-Planck-Institute for Astronomy (MPIA), the Max-Planck-Institute for Astrophysics (MPA), New Mexico State University, Ohio State University, University of Pittsburgh, University of Portsmouth, Princeton University, the United States Naval Observatory, and the University of Washington.
References
- Abazajian, K. N., Adelman-McCarthy, J. K., Agüeros, M. A., et al. 2009, ApJS, 182, 543 [NASA ADS] [CrossRef] [Google Scholar]
- Betancort-Rijo, J. E., & Trujillo, I. 2009 [arXiv:0912.1051] [Google Scholar]
- Betancort-Rijo, J. E., Sanchez-Conde, M. A., Prada, F., & Patiri, S. G. 2006, ApJ, 649, 579 [NASA ADS] [CrossRef] [Google Scholar]
- Betancort-Rijo, J., Patiri, S. G., Prada, F., & Romano, A. E. 2009, MNRAS, 400, 1835 [NASA ADS] [CrossRef] [Google Scholar]
- Blanton, M. R., Hogg, D. W., Bahcall, N. A., et al. 2003, ApJ, 592, 819 [NASA ADS] [CrossRef] [Google Scholar]
- Blanton, M. R., Schlegel, D. J., Strauss, M. A., et al. 2005, AJ, 129, 2562 [NASA ADS] [CrossRef] [Google Scholar]
- Blake, C., Brough, S., Colless, M., et al. 2010, MNRAS, 406, 803 [NASA ADS] [Google Scholar]
- Cabré, A., & Gaztañaga, E. 2009, MNRAS, 396, 1119 [NASA ADS] [CrossRef] [Google Scholar]
- Ceccarelli, L., Padilla, N. D., Valotto, C., & Lambas, D. G. 2006, MNRAS, 373, 1440 [NASA ADS] [CrossRef] [Google Scholar]
- Cole, S., Fisher, K. B., & Weinberg, D. H. 1994, MNRAS, 267, 785 [NASA ADS] [Google Scholar]
- Cuesta, A. J., Betancort-Rijo, J. E., Gottlöber, S., et al. 2008, MNRAS, 385, 867 [NASA ADS] [CrossRef] [Google Scholar]
- Gottlöber, S., Lokas, E., Klypin, A., & Hoffman, Y. 2003, MNRAS, 344, 715 [NASA ADS] [CrossRef] [Google Scholar]
- Guzzo, L., Pierleoni, M., Meneux, B., et al. 2008, Nature, 451, 541 [NASA ADS] [CrossRef] [PubMed] [Google Scholar]
- Hamilton, A. J. S. 1998, ASSL, 231, 185 [Google Scholar]
- Hawkins, E., Maddox, S., Cole, S., et al. 2003, MNRAS, 346, 78 [Google Scholar]
- Hogg, D. 1999 [arXiv:astro-ph/9905116] [Google Scholar]
- Jarosik, N., Bennett, C. L., Dunkley, J., et al. 2011, ApJS, 192, 14 [NASA ADS] [CrossRef] [Google Scholar]
- Kaiser, N. 1987, MNRAS, 227, 1 [NASA ADS] [CrossRef] [Google Scholar]
- Okumura, T., Matsubara, T., Eisenstein, D. J., et al. 2008, ApJ, 676, 889 [NASA ADS] [CrossRef] [MathSciNet] [Google Scholar]
- Padilla, N. D., Ceccarelli, L., & Lambas, D. G. 2005, MNRAS, 363, 977 [NASA ADS] [CrossRef] [Google Scholar]
- Patiri, S. G., Betancort-Rijo, J., & Prada, F. 2006a, MNRAS, 368, 1132 [NASA ADS] [CrossRef] [Google Scholar]
- Patiri, S. G., Betancort-Rijo, J. E., Prada, F., Klypin, A., & Gottlöber, S. 2006b, MNRAS , 369, 335 [NASA ADS] [CrossRef] [Google Scholar]
- Percival, W. J., & White, M. 2009, MNRAS, 393, 297 [NASA ADS] [CrossRef] [Google Scholar]
- Percival, W. J., Burkey, D., Heavens, A., et al. 2004, MNRAS, 353, 1201 [NASA ADS] [CrossRef] [Google Scholar]
- Peacock, J. A., Cole, S., Norberg, P., et al. 2001, Nature, 410, 169 [NASA ADS] [CrossRef] [PubMed] [Google Scholar]
- Ross, A. J., Percival, W. J., Crocce, M., Cabré, A., & Gaztañaga, E. 2011, MNRAS, 415, 2193 [NASA ADS] [CrossRef] [Google Scholar]
- Sheth, R. K., & Tormen, G. 2002, MNRAS, 329, 61 [NASA ADS] [CrossRef] [Google Scholar]
- Strauss, M. A., & Willick, J. A. 1995, PhR, 261, 271 [Google Scholar]
- Tinker, J. L., Weinberg, D. H., & Zheng, Z. 2006, MNRAS, 368, 85 [NASA ADS] [Google Scholar]
- Zehavi I., Zheng, Z., Weinberg, D. H., et al. 2005, ApJ, 630, 1 [Google Scholar]
All Tables
Complete statistics of large voids found in our volume-limited galaxy sample extracted from the SDSS DR7.
All Figures
|
Fig. 1 Probability distribution of |cos θ| for voids larger than 15 h-1Mpc and galaxies located in shells of 2 h-1Mpc (filled circles). The full flat line indicates the distribution for isotropy. The dashed line is a theoretical prediction, see text for details. |
| In the text | |
Current usage metrics show cumulative count of Article Views (full-text article views including HTML views, PDF and ePub downloads, according to the available data) and Abstracts Views on Vision4Press platform.
Data correspond to usage on the plateform after 2015. The current usage metrics is available 48-96 hours after online publication and is updated daily on week days.
Initial download of the metrics may take a while.