| Issue |
A&A
Volume 541, May 2012
|
|
|---|---|---|
| Article Number | A158 | |
| Number of page(s) | 7 | |
| Section | Astrophysical processes | |
| DOI | https://doi.org/10.1051/0004-6361/201219014 | |
| Published online | 22 May 2012 | |
Recent evaluation of the 7Li(p, α)4He reaction rate at astrophysical energies via the Trojan Horse method⋆
1 Dipartimento di Fisica e Astronomia, Università di Catania,
Italy
e-mail: llamia@lns.infn.it
2
Laboratori Nazionali del Sud-INFN, Catania, Italy
3
Centro Siciliano di Fisica Nucleare e Struttura della Materia
(CSFNSM), Catania,
Italy
Received:
10
February
2012
Accepted:
15
March
2012
Context. The charged-particle induced reactions on lithium have been studied by several works. In particular, several direct measurements of the 7Li(p, α)4He reaction have been performed to extrapolate its low-energy astrophysical S(E)-factor and evaluate the electron screening potential, Ue.
Aims. In view of recent direct measurements, we discuss our estimate of the bare-nucleus S(E)-factor and an evaluation of the corresponding reaction rate. Moreover, we present the extracted electron screening potential.
Methods. The Trojan Horse method (THM) allows us to measure the 7Li(p, α)4He bare-nucleus S(E)-factor down to energies of ~10 keV, rendering unnecessary the extrapolation procedure typically used by the direct measurements. The 7Li(p, α)4He S(E)-factor is deduced from the 2H(7Li, α4He)n reaction by selecting the quasi-free contribution to the reaction yield. The plane-wave impulse approximation has proved an effective approach as distortions appear negligible.
Results. The THM enable us to measure the 7Li(p, α)4He S(E)-factor over the energy region of interest for astrophysics, namely 0.01 < Ecm < 0.4 MeV. The zero-energy S(E)-factor and the Ue electron screening potential have been measured and compared with the available direct data. From the TH measure of the 7Li(p, α)4He S(E)-factor, the reaction rate calculation has been performed in correspondence with the temperature window of 0.01 < T9 < 2, which is typical of several astrophysical sites where Li burning could shed light on some open questions, such as mixing phenomena. A variation of ~13%, with respect the adopted NACRE one, has been found at temperatures of about T9 = 10-3, while a variation of ~5% has been found at higher temperatures. By considering in the calculation the upper and lower limits to the TH reaction rate, no significant variation in the Li abundances of low mass giant stars follows or, if any modification occurs, this is negligible in comparison to the uncertainties in the free parameters considered in the extra-mixing model of Palmerini and collaborators.
Key words: nuclear reactions, nucleosynthesis, abundances / stars: abundances / stars: interiors
Table 2 is also available in electronic form at the CDS via anonymous ftp to cdsarc.u-strasbg.fr (130.79.128.5) or via http://cdsarc.u-strasbg.fr/viz-bin/qcat?J/A+A/541/A158
© ESO, 2012
1. Introduction
The 7Li(p, α)4He (Q = 17.35 MeV) is the closing reaction of the PPI chain, which contributes to the amount of alpha particles produced and to about 10% of the energy budget provided by the whole PP chain. Being the main channel of Li burning in astrophysical environments, this reaction is involved in the challenging scenarios of both stellar and primordial Li nucleosynthesis. In the case of the latter, the discrepancy of about a factor of three between the predictions of SBBN (standard Big Bang nucleosynthesis) models and the Li abundances observed in halo stars represents the well-known and still open lithium problem. A large number of possible explanations of this discrepancy have been proposed, from stellar phenomena, to non-standard Big Bang nucleosynthesis models. An observation reported in Caffau et al. (2011), of an extremely low-metallicity star with a Li abundance far beneath the Spite Plateau, suggests that an efficient stellar Li-depletion mechanism is also at play in ancient stars. Standard STellar Models (SSTMs) predict a Li depletion in low- and intermediate-mass stars during the pre-main sequence (pMS), on the MS for K and M dwarfs, and, finally, at the beginning of the red giant branch (RGB) phase (Pinsonneault 1997; Sestito et al. 2005), and further at the first dredge-up (Iben 1967), when the deepening convective envelope mixes the external layers with hydrogen-processed material. However, since Li (as for other light nuclei, e.g. D, 9Be, 10,11B) is very fragile and undergoes efficient proton captures at relative low temperatures, of up to ~2.5 × 10⁶ K, where its abundance might be depleted during the various evolutionary phases, as for other mass transport phenomenon affecting outer stellar layers just below the envelope (Pinsonneault 1997; Sestito et al. 2005; Boesgaard 2005; Charbonnel 1994). A first interpretation of the strong decrease in Li abundance observed in the Sun and the F-G stars of the Galactic disk was first proposed by Michaud (1986) and Michaud & Charbonnau (1991), in terms of diffusive mixing in combination with the rapid shrinking of the convective envelope. This idea has been corroborated by a large number of subsequent works and a non-convective mechanism, linking the H-burning region to the stellar envelope, has been shown to be required by many authors to explain the Li abundances and other chemical anomalies in evolved stars (see e.g. Wasserburg et al. 1994; Sackmann & Boothroyd 1999; Charbonnel & Do Nascimiento 1998; Cantiello & Langer 2010). Several physical phenomena have been proposed to drive this extra-mixing (Pinsonneault 1997; Talon 2008). In particular, a mass transport induced by stellar rotation seems to be adequate to account for the Li depletion that occurs on the MS, thanks to the long scales time available (Cantiello & Langer 2010), although this has been shown to be rather ineffective in evolved stars (Palacios et al. 2006), for which various hypotheses (as thermohaline diffusion, gravity waves and magnetic buoyancy) are still discussed in the literature (Eggleton et al. 2008; Charbonnel & Zahn 2007; Busso et al. 2007a; Denissenkov 2010; Denissenkov & Mayfield 2010). The difficulty in understanding the Li abundance in giant stars is increased by the observation of both Li-rich and Li-poor stars belonging to the first and the second giant branchs. The hot bottom burning accounts for high Li amount in giants with masses higher than ~5 M⊙, while in low-mass objects, non-convective mixing mechanisms may account for Li enrichment as well as Li-depletion depending on the mass transport velocity (Sackmann & Boothroyd 1999; Guandalini et al. 2007; Palmerini et al. 2011). In these complex scenarios, the amount of Li in envelopes of young and evolved stars is one of the most powerful probes of stellar structure and the nature of mixing phenomena. Hence, a precise determination of the bare-nucleus cross-section in the relatively low-energy region typical of these astrophysical sites is required.
However, the low-energy direct measurements of an astrophysically relevant reaction are often hindered by the Coulomb barrier between the interacting nuclei, which is usually on the order of few ~MeV, drastically reducing the reaction cross-section values to the order of nano or picobarn. Moreover, even if in the past few years several efforts have been made to improve the measurements of low-energy nuclear-reaction cross-sections, the presence of the electron screening effect (Rolfs & Rodney 1988; Assenbaum et al. 1987; Strieder et al. 2001), due to the electronic clouds surrounding the interacting ions, prevents one from measuring the bare-nucleus cross-section, which is the input parameter for astrophysical applications.
Nuclear-reaction cross-sections measured in the laboratory exhibit an enhancement of their
values through the factor (Rolfs & Rodney 1988)  (1)where
σsh is the shielded nuclear cross-section measured in the
laboratory, σb the cross-section between the bare nuclei without
any contribution from atomic electrons, which is the one of interest to astrophysical
applications, and Ue the electron screening potential in the
laboratory. The combined effects of Coulomb barrier penetration and electron screening mean
that they are almost inaccessible for the energy region of interest to astrophysics that,
for the lithium case, goes from a few keV up to hundred
keV. Therefore, extrapolation is the most common way to obtain the cross-section
at astrophysical energies; because of its exponential decrease, the
S(E)-factor
(1)where
σsh is the shielded nuclear cross-section measured in the
laboratory, σb the cross-section between the bare nuclei without
any contribution from atomic electrons, which is the one of interest to astrophysical
applications, and Ue the electron screening potential in the
laboratory. The combined effects of Coulomb barrier penetration and electron screening mean
that they are almost inaccessible for the energy region of interest to astrophysics that,
for the lithium case, goes from a few keV up to hundred
keV. Therefore, extrapolation is the most common way to obtain the cross-section
at astrophysical energies; because of its exponential decrease, the
S(E)-factor  (2)is generally used,
because of its smoothly varying energy trend with respect to the exponential behavior of the
cross-section (Rolfs & Rodney 1988).
(2)is generally used,
because of its smoothly varying energy trend with respect to the exponential behavior of the
cross-section (Rolfs & Rodney 1988).
For the 7Li(p, α)4He reaction, the low-energy
extrapolation of the direct measurement of Engstler et al. (1992) leads to a value of zero-energy bare-nucleus
S(E)-factor S(0) = 59 ± 23 keV b, where
the ~40% error is derived from the absolute cross-section determination (see Engstler
et al. 1992, for details). The obtained electron
screening potential value was Ue = 300 ± 280 eV and
Ue = 300 ± 160 eV where the atomic or molecular lithium
targets were considered (see Engstler et al. 1992,
for details). The low-energy extrapolation of Engstler et al. (1992) is included in the NACRE compilation (Angulo et al. 1999). In Cruz et al. (2005) and Cruz et al. (2008), a new
7Li(p, α) reaction cross-section measurement was reported,
covering the energy range 30–100 keV and 90–1740 keV, respectively, by using different
lithium implanted targets. The obtained values for the zero-energy
S(E)-factor and for electron screening potential are
S(0) = 55.6 keV
b and
keV
b and  eV
(Li2WO4 target) (Cruz et al. 2005, 2008).
eV
(Li2WO4 target) (Cruz et al. 2005, 2008).
To reduce the uncertainties connected with extrapolations, several indirect methods have been developed in the past few years to complement the information available from direct measurements in the region of interest to astrophysics. In particular, the Trojan Horse method (THM) has provided a valid alternative approach to measure the bare nucleus S(E)-factor of charged-particle induced reactions, free of Coulomb suppression and electron screening effects (see Tumino et al. 2007). However, the THM does not allow us to extract the S(E)-factor in absolute units, hence the extraction of the S(E)-factor for an astrophysically relevant reaction via the THM requires a normalization to the direct measurements performed at higher energies, as discussed in Spitaleri et al. (2004).
The study of the 7Li(p, α)4He reaction through the THM allowed us to extend the available, e.g. direct, information about the behavior of the astrophysical S(E)-factor even in the extrapolation energy region relevant to astrophysics, where both Coulomb barrier penetration and electron screening effects are dominant. In previous THM studies (Lattuada et al. 2001; Pizzone et al. 2003), the 7Li(p, α)4He reaction was studied in the energy range 10–400 keV. In particular, the THM data were normalized to the available direct data of Engstler et al. (1992), and the extracted TH S(0)-factor and electron screening potential values were 55 ± 3 keV b and 330 ± 40 eV, respectively (Lattuada et al. 2001). The same THM data were included in the compilation of solar fusion cross-sections discussed in Adelberger et al. (2011).
However on the basis of the direct measurements of Cruz et al. (2008), a new normalization of the same TH data of Lattuada et al. (2001) have been performed, since the extraction of the TH S(E)-factor in absolute units involves the application of a normalization procedure to the available direct data, as previously discussed in Spitaleri et al. (2004). This study is then focused on the extraction of the TH S(E)-factor for the 7Li(p, α)4He reaction, when the data of Cruz et al. (2008) were adopted to normalize the TH data. It is also focused on the evaluation of the 7Li(p, α)4He reaction rate and its variation from the reaction rate adopted in the NACRE compilation of Angulo et al. (1999).
2. The Trojan Horse method
The Trojan Horse method is an indirect technique that allows one to extract the bare-nucleus cross-section of a charged-particle induced reaction a + x → c + C at astrophysical energies free of Coulomb suppression, by properly selecting the quasi-free (QF) contribution of an appropriate 2 → 3 reaction a + A → c + C + s, performed at energies well above the Coulomb barrier (Spitaleri et al. 2011, 1990; Baur et al. 1986). The QF A + a → c + C + s reaction between the projectile a and the target A, whose wave function is assumed to have a large amplitude for the A = x⊕s cluster configuration, can be described by the pole diagram sketched in Fig. 1 (Shapiro 1967).
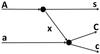 |
Fig. 1 Pole diagram describing the quasi-free (QF) a + A → c + C + s reaction discussed in the text. The clusters x and s are the participant and the spectator of the binary a(x,c)C reaction. |
In this framework, the projectile a interacts only with a part
(x-cluster) of the target nucleus A,
while s is considered as a spectator to the
a(x,c)C virtual reaction. Following the
simple PWIA, the three body reaction can be factorized into two terms corresponding to the
vertices of Fig. 1 and is given by (Neudatchin et al.
1965; Jacob et al. 1966) 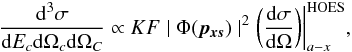 (3)where:
-
1.
(dσ/dΩ)
 is the half-off-energy-shell (HOES) differential cross-section for the binary
a(x,c)C reaction;
is the half-off-energy-shell (HOES) differential cross-section for the binary
a(x,c)C reaction; -
2.
KF is a kinematical factor containing the final-state phase space factor and is a function of the masses, momenta, and angles of the outgoing particles;
-
3.
|Φ(pxs)|2 is the momentum distribution for the x − s inter-cluster motion usually described in terms of Hänkel, Eckart, or Hulthén functions depending on the x − s system.
After the introduction of the function describing the penetration through the Coulomb barrier and the normalization to the available direct data, it is possible to extract the bare-nucleus S(E)-factor by following Eq. (2), where the THM cross-section deduced by Eq. (3) is the bare nucleus one. An exhaustive discussion of the TH experimental approach is given in Spitaleri et al. (2004), while different applications could be found in Lamia et al. (2007), La Cognata et al. (2010), and Lamia et al. (2012).
3. The THM applied to the 7Li(p, α)4He reaction
The study of the 7Li(p, α)4He reaction was performed
by applying the THM to the
2H(7Li, αα)n QF reaction, using
deuteron as a TH-nucleus owing to its simple p-n structure. The details about the
experimental setup and the data analysis can be found in Lattuada et al. (2001). The experiment was performed at the Laboratori
Nazionali del Sud (Catania, Italy) using 7Li beams with three different energies,
namely Ebeam = 19.0, 19.5, 20.0 MeV. The lithium beam was
delivered onto a 250 μg/cm2-thick deuterated polyethylene target
with an intensity of ~10 pnA. The detection setup consisted of six silicon position
sensitive detectors (PSD) displaced in the scattering chamber to cover the QF-angular
region, i.e. the kinematic region at which a strong contribution from the QF-mechanism is
expected. Since the p-n intercluster motion in deuteron mainly occurs in s-wave, the
QF-angular region corresponds to low values of the undetected neutron
momentum. The selected data, corresponding to neutron momentum values lower than 40 MeV/c,
were normalized to the direct measurements of Engstler et al. (1992) and then fitted via a second order polynomial:  (4)The fit to the
bare-nucleus Sb(E)-factor leads to a value of
Sb(0) = 55 ± 3 keV barns, where the quoted error is only the
statistical one. The data also suffer from a systematic error of ~10% caused by the
normalization of the indirect data to the direct data of Engstler et al. (1992). The same data were included in the review paper of
Adelberger et al. (2011), where the recommended value
is Sb(0) = 55 ± 6 keV barn.
(4)The fit to the
bare-nucleus Sb(E)-factor leads to a value of
Sb(0) = 55 ± 3 keV barns, where the quoted error is only the
statistical one. The data also suffer from a systematic error of ~10% caused by the
normalization of the indirect data to the direct data of Engstler et al. (1992). The same data were included in the review paper of
Adelberger et al. (2011), where the recommended value
is Sb(0) = 55 ± 6 keV barn.
We compare the
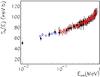 |
Fig. 2 The bare nucleus TH Sb(E)-factor (Lattuada et al. 2001) (black points), normalized to the direct ones of Cruz et al. (2005, 2008) (red and blue circles, respectively) via the renormalization constant k. |
same experimental TH data of Lattuada et al. (2001)
with the recent direct measurements, thus allowing for a new normalization to the
recommended values of Cruz et al. (2008), being the
low-energy data of Cruz et al. (2005) affected by the
electron screening effect. The normalization procedure leads to the value of
k = 0.96, where k is the renormalization factor of the
THM data, with an evaluated error of ~4%. This fit was performed in the energy range
200−400 keV, as done in Lattuada et al. (2001). The
TH data of Lattuada et al. (2001) were then scaled to
the direct ones of Cruz et al. (2008) by means of the
renormalization constant k. In Fig. 2,
the TH data are shown as black points with their statistical error, while the empty circles
refer to the data of Cruz et al. (2005) (blue) and
Cruz et al. (2008) (red). The TH data shown in
Fig. 2 were then fitted via the polynomial function
given in Eq. (4) leading to  (5)The fit of the
bare-nucleus Sb(E)-factor given in Eq. (5), shown as a black full line in Fig. 3, yields Sb(0) = 53 ± 5 keV b,
where the evaluated error takes into account a ~4% related to the normalization procedure,
a ~6% related to the present statistic, and a further error of ~6% related to the
uncertainty (on the average) on the direct data of Cruz et al. (2008). In Eq. (5), the
energy E is expressed in MeV. To extract the value of the electron
screening potential, the low-energy (<60 keV) direct data of
Engstler et al. (1992) and Cruz et al. (2005) are fitted via the formula
(5)The fit of the
bare-nucleus Sb(E)-factor given in Eq. (5), shown as a black full line in Fig. 3, yields Sb(0) = 53 ± 5 keV b,
where the evaluated error takes into account a ~4% related to the normalization procedure,
a ~6% related to the present statistic, and a further error of ~6% related to the
uncertainty (on the average) on the direct data of Cruz et al. (2008). In Eq. (5), the
energy E is expressed in MeV. To extract the value of the electron
screening potential, the low-energy (<60 keV) direct data of
Engstler et al. (1992) and Cruz et al. (2005) are fitted via the formula  (6)leaving
Ue as the only free-parameter. The fit fixes the free
parameter to Ue = 425 ± 60 eV, where the quoted error takes into
account a ~14% related to the uncertainties on the low-energy direct data of Engstler
et al. (1992). The full line in Fig. 3 represents the bare nucleus
Sb(E)-factor from Eq. (5), while the dashed line is the result of our
fit. In addition, in Table 1, the values of both
Sb(0) and Ue, available in the
literature, are reported.
(6)leaving
Ue as the only free-parameter. The fit fixes the free
parameter to Ue = 425 ± 60 eV, where the quoted error takes into
account a ~14% related to the uncertainties on the low-energy direct data of Engstler
et al. (1992). The full line in Fig. 3 represents the bare nucleus
Sb(E)-factor from Eq. (5), while the dashed line is the result of our
fit. In addition, in Table 1, the values of both
Sb(0) and Ue, available in the
literature, are reported.
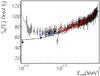 |
Fig. 3 The bare nucleus TH Sb(E)-factor of Lattuada et al. (2001) (black points), normalized to the direct ones of Cruz et al. (2005, 2008) (red and blue circles, respectively) via the renormalization constant k. The direct measurement of Engstler et al. (1992) is also reported (open diamonts). The full line describes the TH Sb(E)-factor while the dashed line is the fit of the low-energy (<60 keV) direct data of Engstler et al. (1992), giving Ue = 425 ± 60 eV. |
Experimental values of the Sb(0)-factor and the electron screening potential Ue, as reported in the different papers, together with the results obtained in this work.
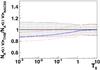 |
Fig. 4 Ratio of the adopted THM 7Li(p, α)4He reaction rate to that evaluated by the NACRE compilation (Angulo et al. 1999) (full blue line), together with THM upper and lower limit (red dashed lines). This is compared with the upper and lower values recommended in NACRE (black dashed lines). |
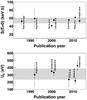 |
Fig. 5 Upper and lower panels show the published values for the zero-energy S(E)-factor and electron screening potential Ue, respectively. The numerical values and the related errors (where given in the original works) are listed in Table 1. |
Adopted and evaluated TH 7Li(p, α)4He reaction rate.
The 7Li(p, α)4He reaction rate was evaluated here by
integrating the TH Sb(E) (as in Eq. (5)) over the energy range explored here, which
corresponds to the temperature range 0.01 ≲ T9 ≲ 2. In the
integration of the S(E)-factor, the low energy trend
assumed by NACRE (Angulo et al. 1999), namely the
extrapolation of Engstler et al. (1992), was replaced
by the TH measurement given here. Thus, the TH reaction rate was expressed by means of the
analytical expression given in the NACRE compilation (Angulo et al. 1999) times a correction factor
fcorr(T9)  (7)with
 (8)where
T9 is the temperature in billions of kelvin. The ratio of the
reaction rate obtained here to that reported in NACRE is shown in Fig. 4, while in Table 2 both the NACRE
reaction rate and the present one are summarized. The 7Li+p reaction rate
evaluated here differs from the adopted one by ~13% at
T9 = 10-3 and of ~5% at the temperature of
T9 = 1, corresponding to the energy range investigated here.
In Fig. 5, we summarize the available measurements of
the zero-energy S(E)-factor and the electron screening
potential. A clear agreement among the S(0) values is evident in all the
measurements performed over the past two decades. A larger uncertainty still affects the
electron screening potential mainly because of the extrapolation procedure applied to the
direct data, as well as the uncertainties in the indirect methods. Further studies, in both
directions, are required to minimize these uncertainties. The average of all the available
measured values in Fig. 5 gives
⟨ S(0) ⟩ = 54 ± 7 MeV b and
⟨ Ue(E) ⟩ = 310 ± 76 eV. The shaded area in
both panels of Fig. 5 represents the ranges of
S(E) and Ue allowed for by
the standard deviations in the different measurements.
(8)where
T9 is the temperature in billions of kelvin. The ratio of the
reaction rate obtained here to that reported in NACRE is shown in Fig. 4, while in Table 2 both the NACRE
reaction rate and the present one are summarized. The 7Li+p reaction rate
evaluated here differs from the adopted one by ~13% at
T9 = 10-3 and of ~5% at the temperature of
T9 = 1, corresponding to the energy range investigated here.
In Fig. 5, we summarize the available measurements of
the zero-energy S(E)-factor and the electron screening
potential. A clear agreement among the S(0) values is evident in all the
measurements performed over the past two decades. A larger uncertainty still affects the
electron screening potential mainly because of the extrapolation procedure applied to the
direct data, as well as the uncertainties in the indirect methods. Further studies, in both
directions, are required to minimize these uncertainties. The average of all the available
measured values in Fig. 5 gives
⟨ S(0) ⟩ = 54 ± 7 MeV b and
⟨ Ue(E) ⟩ = 310 ± 76 eV. The shaded area in
both panels of Fig. 5 represents the ranges of
S(E) and Ue allowed for by
the standard deviations in the different measurements.
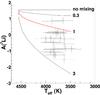 |
Fig. 6 Evolution of the 7Li abundance in the envelope of a 1.5
M⊙ and solar-metallicity RGB star, temporal evolution
proceeding from left to right from the luminosity bump to the end of the RGB phase.
The standard definition of the lithium abundance is here used, namely
A(7Li) = 12+ |

4. Conclusions
We have performed a new determination of the S(E)-factor and electron screening potential for the 7Li(p, α)4He reaction via the THM and compared this with a previous TH investigation of the same experimental data, as discussed in Lattuada et al. (2001). This was necessary mainly in light of the direct measurements of Cruz et al. (2005, 2008). The values extracted here, by means of the procedure described above, are Sb(0) = 53 ± 5 keV barns and Ue = 425 ± 60 eV for the bare-nucleus S(E)-factor at zero-energy and the electron screening potential, respectively. When compared with the previous TH investigation of Lattuada et al. (2001), the S(0) extracted here deviates by ~4%, while Ue deviates by ~23%. In Table 1, the values of both S(0) and Ue available in the literature, are reported as well as the values extracted here. The reaction rate determination shows that the NA ⟨ σv ⟩ THM deviates from ~5% to ~13% as the temperature decreases from T9 = 1 down to T9 = 10-3, requiring an evaluation of the effect of these changes on the different astrophysical scenarios. Moreover, recommended values, obtained taking the average of the results obtained in the past two decades, are given for S(0) and Ue (see Fig. 5). To evaluate the impact of the TH reaction rate evaluated in this work, we verified that the variation is too small to account for the amount of Li abundance in the envelopes of low-mass giant stars affected by extra-mixing1. In more detail, Fig. 6 shows the evolution of 7Li abundance in the envelope of a 1.5 M⊙ and solar-metallicity RGB star. The extra-mixing has been assumed at play from the luminosity-bump to the end of the RGB phase. The red hatched area in-between the red solid lines represents the Li abundance evolution calculated by using the upper and lower TH 7Li(p, α)4He reaction rates, while the mixing rate and the mixing depth were kept constant at the average values of 10-7 M⊙/yr and 0.222, respectively. The black curves represent the temporal evolution of the Li-abundance obtained for different values from 0 (no mixing at play) to 3 × 10⁻⁷ M⊙/yr assumed for the mixing rate (see Palmerini et al. 2011, for details about our adopted definition of extra-mixing and its free parameters). In conclusion, the variation in the TH reaction rate evaluated here does not significantly modify the Li burning scale time with respect to the Li production (from electron capture on 7Be) and the mass transport scales time. Moreover, we verified that even considering in the calculation the upper and lower limits to the TH reaction rate, no significant variation in the Li abundance follows or, if any modification occurs, this is negligible compared to the uncertainties in the free parameters considered in the extra-mixing model.
Acknowledgments
The authors wish to thank J. Cruz for the useful suggestions given while writing the present paper.
References
- Adelberger, E. G., García, A., Hamish Robertson, R. G., et al. 2011, Rev. Mod. Phys., 83, 195 [NASA ADS] [CrossRef] [Google Scholar]
- Aliotta, M., Spitaleri, C., Lattuada, M., et al. 2000, Eur. Phys. J. A, 9, 435 [NASA ADS] [CrossRef] [EDP Sciences] [Google Scholar]
- Angulo, C., Arnould, M., Rayet, M., et al. 1999, Nucl. Phys. A, 656, 3 [NASA ADS] [CrossRef] [Google Scholar]
- Assenbaum, H. J., Langanke, K., & Rolfs, C. 1987, Z. Phys., 327, 461 [Google Scholar]
- Barker, F. C. 2000, Phys. Rev. C, 62, 044607 [NASA ADS] [CrossRef] [Google Scholar]
- Baur, G. 1986, Phys. Lett. B, 178, 135 [NASA ADS] [CrossRef] [Google Scholar]
- Boesgaard, A. M., & Deliyannis, C. P. 2005, ApJ, 621, 991 [Google Scholar]
- Busso, M., Wasserburg, G. J., Nollett, K. M., & Calandra, A. 2007, ApJ, 671, 802 [NASA ADS] [CrossRef] [Google Scholar]
- Caffau, E., Bonifacio, P., & François, P. 2011, Nature, 477, 67 [NASA ADS] [CrossRef] [PubMed] [Google Scholar]
- Cantiello, M., & Langer, N. 2010, A&A, 521, A9 [NASA ADS] [CrossRef] [EDP Sciences] [Google Scholar]
- Charbonnel, C., & Do Nascimento, J. D. Jr. 1998, A&A, 336, 915 [NASA ADS] [Google Scholar]
- Charbonnel, C., & Zahn, J.-P. 2007, A&A, 467, L15 [NASA ADS] [CrossRef] [EDP Sciences] [Google Scholar]
- Charbonnel, C., Vauclair, S., Maeder, A., Meynet, G., & Schaller, G. 1994, A&A, 283, 155 [NASA ADS] [Google Scholar]
- Cruz, J., Fülöp, Z., Gyürky, G., et al. 2005, Phys. Lett. B, 624, 181 [NASA ADS] [CrossRef] [Google Scholar]
- Cruz, J., Luis, H., Fonseca, M., et al. 2008, J. Phys. G, 35, 014004 [Google Scholar]
- Denissenkov, P. A. 2010, ApJ, 723, 563 [NASA ADS] [CrossRef] [Google Scholar]
- Denissenkov, P. A., Pinsonneault, M., & MacGregor, K. B. 2009, ApJ, 696, 1823 [NASA ADS] [CrossRef] [Google Scholar]
- Eggleton, P. P., Dearborn, D. S. P., & Lattanzio, J. C. 2008, ApJ, 677, 581 [NASA ADS] [CrossRef] [Google Scholar]
- Engstler, S., Raimann, G., Angulo, C., et al. 1992, Z. Phys. A, 342, 471 [Google Scholar]
- Guandalini, R., Palmerini, S., Busso, M., & Uttenthaler, S. 2009, PASA, 26, 168 [NASA ADS] [Google Scholar]
- Iben, I. Jr,Kalata, K., & Schwartz, J. 1967, ApJ, 150, 1001 [NASA ADS] [CrossRef] [Google Scholar]
- Jacob, G., & Maris, Th. A. J. 1966, Rev. Mod. Phys., 38, 121 [NASA ADS] [CrossRef] [Google Scholar]
- La Cognata, M., Spitaleri, C., Tumino, A., et al. 2005, Phys. Rev. C, 72, 065802 [NASA ADS] [CrossRef] [Google Scholar]
- La Cognata, M., Spitaleri, C., Mukhamezhanov, A., et al. 2010, ApJ, 708, 796 [Google Scholar]
- Lamia, L., Romano, S., Carlin, N., et al. 2007, Nucl. Phys. A, 787, 309c [NASA ADS] [CrossRef] [Google Scholar]
- Lamia, L., Spitaleri, C., Burjan, V., et al. 2012, J. Phys. G, 39, 015106 [Google Scholar]
- Lattuada, M., Pizzone, R. G., Typel, S., et al. 2001, ApJ, 562, 1076 [Google Scholar]
- Luck, R. E., & Lambert, D. L. 1982, ApJ, 256, 189 [NASA ADS] [CrossRef] [Google Scholar]
- Michaud, G. 1986, ApJ, 302, 650 [NASA ADS] [CrossRef] [Google Scholar]
- Michaud, G., & Charbonnau, P. 1991, Space Sci. Rev., 57, 1 [NASA ADS] [CrossRef] [Google Scholar]
- Neudatchin, U., & Smirnov, Y. F. 1965, Atom. Energ. Rev., 3, 157 [Google Scholar]
- Palacios, A., Charbonnel, C., Talon, S., & Siess, L. 2006, A&A, 453, 261 [NASA ADS] [CrossRef] [EDP Sciences] [Google Scholar]
- Palmerini, S., Cristallo, S., Busso, M., et al. 2011, ApJ, 741, 26 [NASA ADS] [CrossRef] [Google Scholar]
- Pinsonneault, M. 1997, ARA&A, 35, 557 [NASA ADS] [CrossRef] [Google Scholar]
- Pizzone, R. G., Spitaleri, C., Lattuada, M., et al. 2003, A&A, 398, 423 [Google Scholar]
- Rolfs, C., & Kavanagh, R. W. 1986, Nucl. Phys. A, 455, 179 [NASA ADS] [CrossRef] [Google Scholar]
- Rolfs, C., & Rodney, W. 1988, Cauldrons in the Cosmos (Chicago: The University of Chicago press) [Google Scholar]
- Sackmann, I.-J., & Boothroyd, A. I. 1999, ApJ, 510, 217 [NASA ADS] [CrossRef] [Google Scholar]
- Sestito, P., Degl’Innocenti, S., Pra da Moroni, P. G., & Randich, S. 2006, A&A, 454, 311 [NASA ADS] [CrossRef] [EDP Sciences] [Google Scholar]
- Shapiro, I. S. 1967, in Interaction of High-Energy Particles and Nuclei, International School of Physics Enrico Fermi, Course 38 (New York: Academic Press), 210 [Google Scholar]
- Spitaleri, C., Lamia, L., Tumino, A., et al. 1990, in Problem of fundamental modern physics II,ed. R. Cherubini, P. Dalpiaz, B. Minetti (World Scientific), 21 [Google Scholar]
- Spitaleri, C., Lamia, L., Tumino, A., et al. 2004, Phys. Rev. C, 69, 055806 [NASA ADS] [CrossRef] [Google Scholar]
- Spitaleri, C., Mukhamedzhanov, A. M., Blokhintsev, L. D., et al. 2011, Phys. Atom. Nucl., 74, 1763 [Google Scholar]
- Strieder, F., Rolfs, C., Spitaleri, C., & Corvisiero, P. 2001, Naturwissenschaften, 88, 461 [NASA ADS] [CrossRef] [Google Scholar]
- Talon, S. 2008, EAS Publ. Ser., 32, 81 [CrossRef] [EDP Sciences] [Google Scholar]
- Tumino, A., Spitaleri, C., Mukhamedzhanov, A., et al. 2007, Phys. Rev. Lett., 98, 252502 [NASA ADS] [CrossRef] [PubMed] [Google Scholar]
- Wang, T. S., Guan, X. C., Fang, K. H., et al. 2011, J. Phys. G, 39, 015201 [NASA ADS] [CrossRef] [Google Scholar]
- Wasserburg, G. J., Boothroyd, A. I., & Sackmann, I.-J. 1995, ApJ, 447, L37 [NASA ADS] [CrossRef] [Google Scholar]
All Tables
Experimental values of the Sb(0)-factor and the electron screening potential Ue, as reported in the different papers, together with the results obtained in this work.
All Figures
|
Fig. 1 Pole diagram describing the quasi-free (QF) a + A → c + C + s reaction discussed in the text. The clusters x and s are the participant and the spectator of the binary a(x,c)C reaction. |
| In the text | |
|
Fig. 2 The bare nucleus TH Sb(E)-factor (Lattuada et al. 2001) (black points), normalized to the direct ones of Cruz et al. (2005, 2008) (red and blue circles, respectively) via the renormalization constant k. |
| In the text | |
|
Fig. 3 The bare nucleus TH Sb(E)-factor of Lattuada et al. (2001) (black points), normalized to the direct ones of Cruz et al. (2005, 2008) (red and blue circles, respectively) via the renormalization constant k. The direct measurement of Engstler et al. (1992) is also reported (open diamonts). The full line describes the TH Sb(E)-factor while the dashed line is the fit of the low-energy (<60 keV) direct data of Engstler et al. (1992), giving Ue = 425 ± 60 eV. |
| In the text | |
|
Fig. 4 Ratio of the adopted THM 7Li(p, α)4He reaction rate to that evaluated by the NACRE compilation (Angulo et al. 1999) (full blue line), together with THM upper and lower limit (red dashed lines). This is compared with the upper and lower values recommended in NACRE (black dashed lines). |
| In the text | |
|
Fig. 5 Upper and lower panels show the published values for the zero-energy S(E)-factor and electron screening potential Ue, respectively. The numerical values and the related errors (where given in the original works) are listed in Table 1. |
| In the text | |
|
Fig. 6 Evolution of the 7Li abundance in the envelope of a 1.5
M⊙ and solar-metallicity RGB star, temporal evolution
proceeding from left to right from the luminosity bump to the end of the RGB phase.
The standard definition of the lithium abundance is here used, namely
A(7Li) = 12+ |
| In the text | |
Current usage metrics show cumulative count of Article Views (full-text article views including HTML views, PDF and ePub downloads, according to the available data) and Abstracts Views on Vision4Press platform.
Data correspond to usage on the plateform after 2015. The current usage metrics is available 48-96 hours after online publication and is updated daily on week days.
Initial download of the metrics may take a while.