Fig. 6
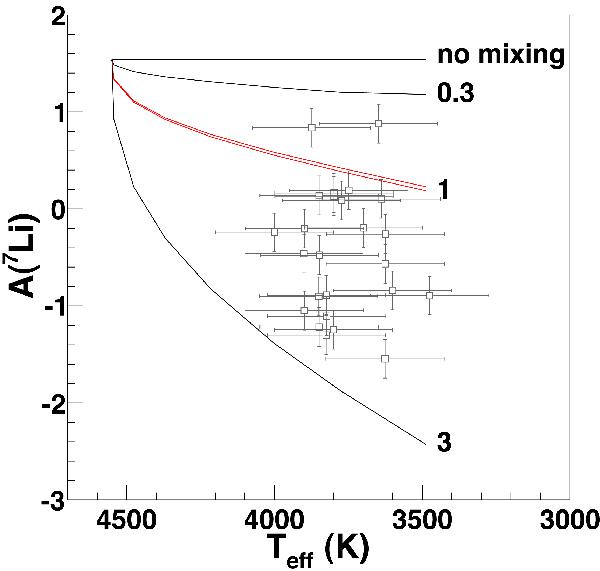
Evolution of the 7Li abundance in the envelope of a 1.5
M⊙ and solar-metallicity RGB star, temporal evolution
proceeding from left to right from the luminosity bump to the end of the RGB phase.
The standard definition of the lithium abundance is here used, namely
A(7Li) = 12+ .
The red solid curves represent the variation in A(7Li) due
to the uncertainty in the TH 7Li(p, α)4He
reaction rate derived here, while the black curves define the allowed region if
different mixing rates (indicated by the labels in unit of
10-7 M⊙/yr) are used in the calculation of
Palmerini et al. (2011) (see text for details). Open symbols represent the amounts of
Li observed in a sample of 25 M-giants (by Luck & Lambert 1982) to compare the spread in the Li-abundance
observations with uncertainties in the
7Li(p, α)4He reaction rate and mixing
parameters with the spread in the observations of low mass evolved stars.
.
The red solid curves represent the variation in A(7Li) due
to the uncertainty in the TH 7Li(p, α)4He
reaction rate derived here, while the black curves define the allowed region if
different mixing rates (indicated by the labels in unit of
10-7 M⊙/yr) are used in the calculation of
Palmerini et al. (2011) (see text for details). Open symbols represent the amounts of
Li observed in a sample of 25 M-giants (by Luck & Lambert 1982) to compare the spread in the Li-abundance
observations with uncertainties in the
7Li(p, α)4He reaction rate and mixing
parameters with the spread in the observations of low mass evolved stars.
Current usage metrics show cumulative count of Article Views (full-text article views including HTML views, PDF and ePub downloads, according to the available data) and Abstracts Views on Vision4Press platform.
Data correspond to usage on the plateform after 2015. The current usage metrics is available 48-96 hours after online publication and is updated daily on week days.
Initial download of the metrics may take a while.