Fig. 3
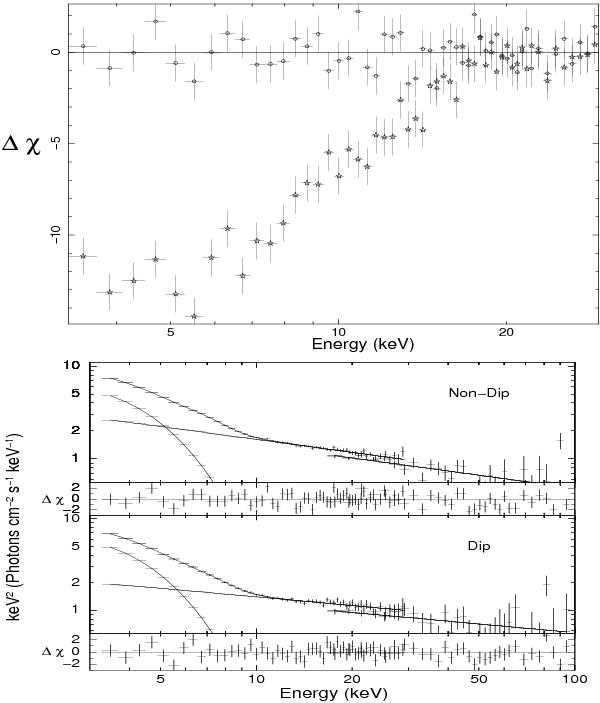
Top: residuals of the non-dip and dip spectra obtained by applying the best-fit spectral parameters of the non-dip spectrum. The high residuals of the dip spectrum (star symbols) show that the spectrum has appreciably changed, which is responsible for the observed type-A QPO in this section. Bottom: the spectral fit to the broadband spectra (3–100 keV) of the non-dip and dip sections.
Current usage metrics show cumulative count of Article Views (full-text article views including HTML views, PDF and ePub downloads, according to the available data) and Abstracts Views on Vision4Press platform.
Data correspond to usage on the plateform after 2015. The current usage metrics is available 48-96 hours after online publication and is updated daily on week days.
Initial download of the metrics may take a while.