Fig. 2
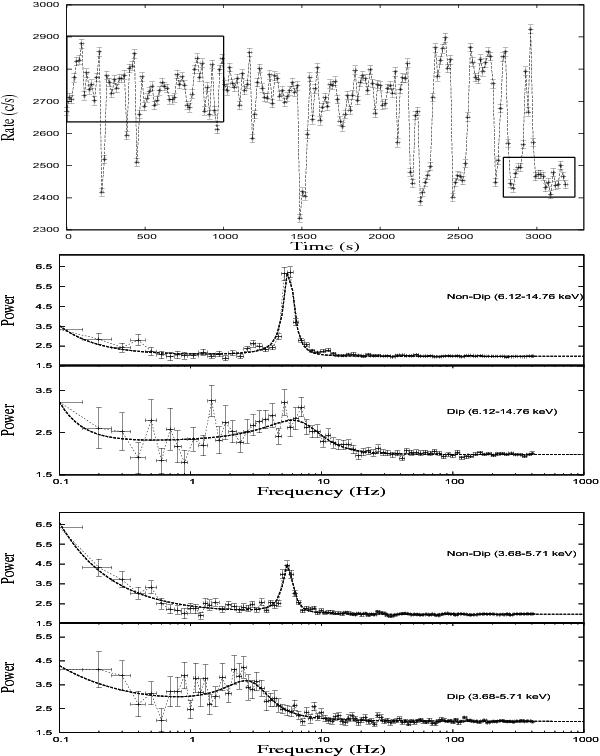
Top: PCA 16 s bin light curve in the 2–20 keV band. The boxes show the sections of non-dip and dip used for PDS and spectral analysis. Middle: the PDS of non-dip and dip sections in the energy band 6.12–14.75 keV along with their best-fits using a power-law+Lorentzian+constant model (shown in thick dashed lines). The wings or harmonics in the non-dip PDS are clearly visible but absent in the dip PDS, which is a characteristic feature observed when a type-B QPO moves into a type-A QPO. Bottom: similar PDSs in the lower energy band (3.68–5.71 keV) are shown. The Poisson noise is not subtracted.
Current usage metrics show cumulative count of Article Views (full-text article views including HTML views, PDF and ePub downloads, according to the available data) and Abstracts Views on Vision4Press platform.
Data correspond to usage on the plateform after 2015. The current usage metrics is available 48-96 hours after online publication and is updated daily on week days.
Initial download of the metrics may take a while.