Free Access
Fig. 5
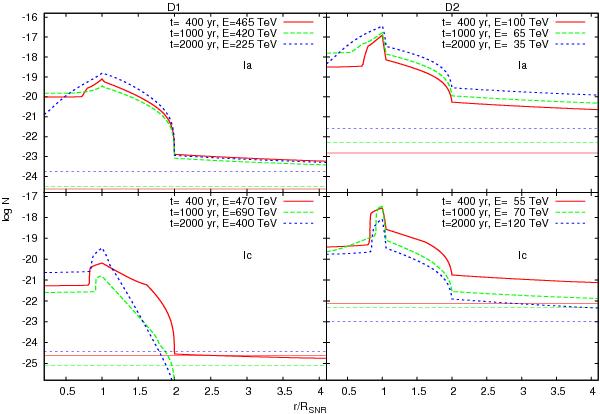
Radial distributions of CRs at the peak energy in the spectra of escaped CRs at the given time (thick lines), compared with the Galactic CR background at the same energies (thin lines) for diffusion models “D1” (left) and “D2” (right). Type-Ia SNRs are shown in the top row and core-collapse SNR in the bottom row.
Current usage metrics show cumulative count of Article Views (full-text article views including HTML views, PDF and ePub downloads, according to the available data) and Abstracts Views on Vision4Press platform.
Data correspond to usage on the plateform after 2015. The current usage metrics is available 48-96 hours after online publication and is updated daily on week days.
Initial download of the metrics may take a while.