Fig. 3
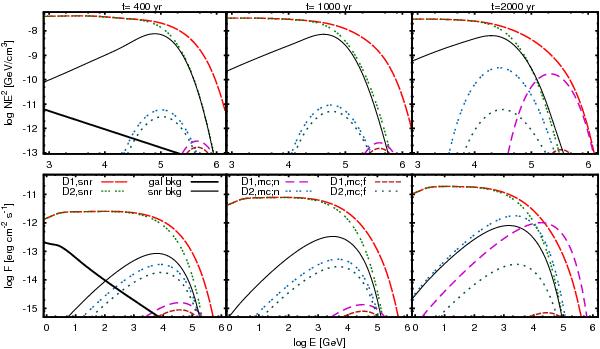
Results for Type-Ia SNR. Top: the time evolution of volume-integrated CR spectra inside the SNR (denoted “snr”) and the MC (denoted “mc”) for two different diffusion models (“D1”/“D2”) and two different distances from the SNR to MC: 12 pc (“n”) and 16 pc (“f”). Bottom: the corresponding hadronic gamma-ray emission spectra. The thick solid lines represent the Galactic CR background and the corresponding gamma-ray emission from the MC, both of which do not depend on time. The thin solid lines represent the spectra of CRs outside the SNR for the D2 model and the corresponding emission from ambient diffuse gas.
Current usage metrics show cumulative count of Article Views (full-text article views including HTML views, PDF and ePub downloads, according to the available data) and Abstracts Views on Vision4Press platform.
Data correspond to usage on the plateform after 2015. The current usage metrics is available 48-96 hours after online publication and is updated daily on week days.
Initial download of the metrics may take a while.