Fig. 4
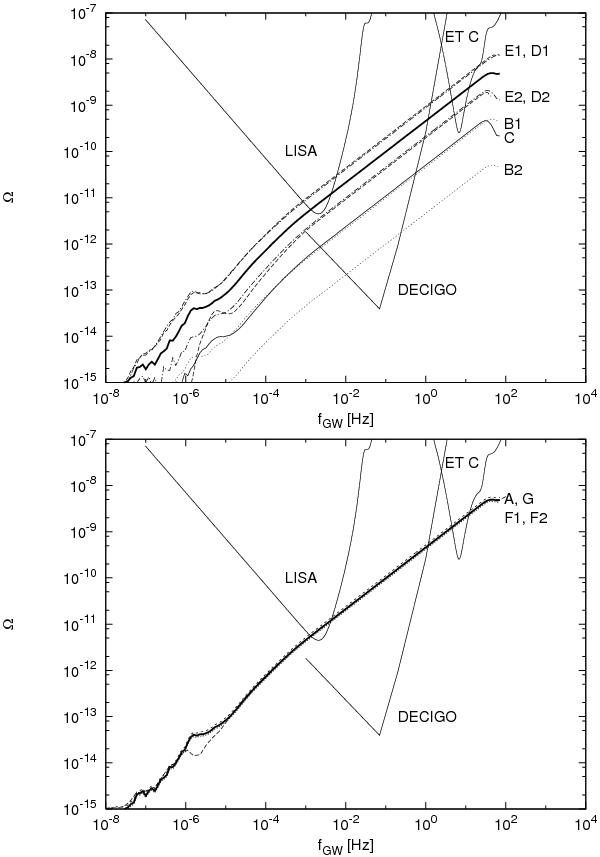
The gravitational wave background from Population III stars. The standard model results are presented as the thick solid line and denoted as A. The thin lines are labeled with a letter denoting the model; for a description, see Table 1. We also present the sensitivities of future gravitational wave experiments. Bottom panel was created for clarity, because the models G, F1, and F2 are no different from the standard model.
Current usage metrics show cumulative count of Article Views (full-text article views including HTML views, PDF and ePub downloads, according to the available data) and Abstracts Views on Vision4Press platform.
Data correspond to usage on the plateform after 2015. The current usage metrics is available 48-96 hours after online publication and is updated daily on week days.
Initial download of the metrics may take a while.