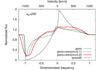
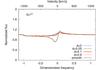
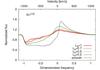
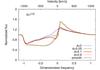
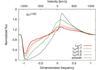
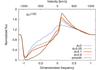
Fig. 5

The effects of the macroclumping (left) and the non-void ICM (right) on the weak (χ0 = 1, the upper panels), intermediate (χ0 = 10, the middle panels), and strong (χ0 = 100, the lower panels) lines. Left: the black dashed lines represent a smooth wind (L0 → 0) and other lines are calculated for a different clump separation parameter L0 as given in the panels. Other model parameters have their default value (Table 1). Right: the black dashed lines represent a smooth wind and other lines are calculated for different values of the ICM density parameter d as given in the panels. Other model parameters have their default value (Table 1).
Current usage metrics show cumulative count of Article Views (full-text article views including HTML views, PDF and ePub downloads, according to the available data) and Abstracts Views on Vision4Press platform.
Data correspond to usage on the plateform after 2015. The current usage metrics is available 48-96 hours after online publication and is updated daily on week days.
Initial download of the metrics may take a while.