Fig. 6
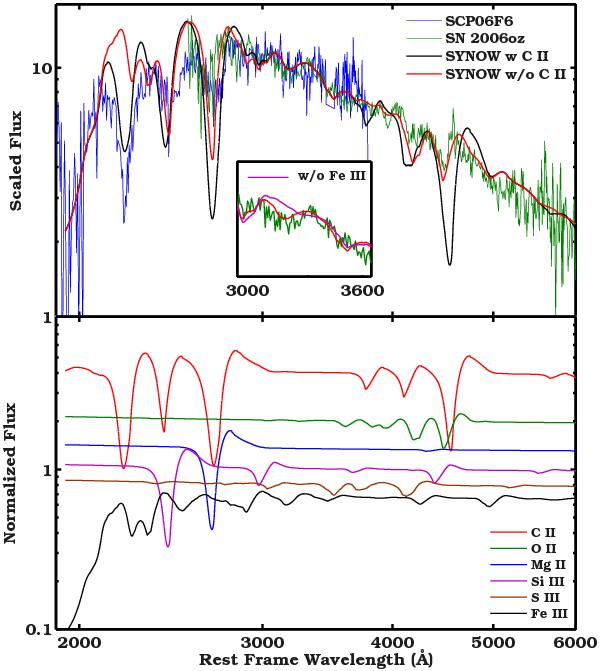
SYNOW fit to the spectra of SN 2006oz and SCP06F6. The observed spectra were brought to the rest-frame by assuming z = 0.376 and z = 1.189, respectively, and their fluxes were scaled to match in the overlapping wavelength region. Two SYNOW models, with and without C ii, are overplotted. The inset shows a zoom in the spectrum of SN 2006oz around 3300 Å. The magenta line (inset only) shows a model without Fe iii that provides a worse fit in this region. The lower panel shows the contribution of the individual ions to the model spectra. The best-fitting model has τ(O ii) = 0.02, τ(Mg ii) = 0.05, τ(Si iii) = 0.5, τ(S iii) = 0.5 and τ(Fe iii) = 0.4.
Current usage metrics show cumulative count of Article Views (full-text article views including HTML views, PDF and ePub downloads, according to the available data) and Abstracts Views on Vision4Press platform.
Data correspond to usage on the plateform after 2015. The current usage metrics is available 48-96 hours after online publication and is updated daily on week days.
Initial download of the metrics may take a while.