Fig. 4
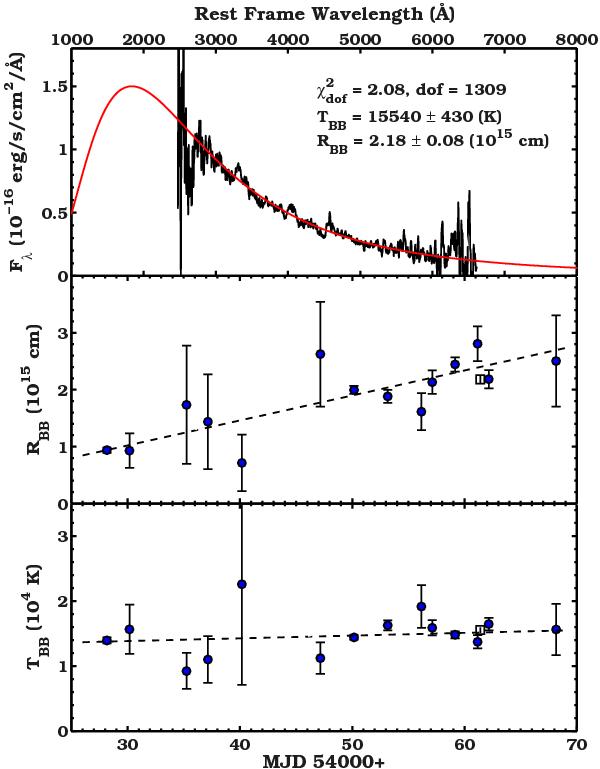
Black-body fits to the SN 2006oz data. In the top panel, a fit to the NOT spectrum is shown. Only data redward of 3000 Å (rest-frame) are included in the fit. The middle and bottom panel show the radius and temperature evolution of SN 2006oz assuming it can be described by a black body. The filled circles are the results of fitting the griz photometry, while the spectrum fit is represented by a square symbol. The dashed lines show linear weighted fits to the data.
Current usage metrics show cumulative count of Article Views (full-text article views including HTML views, PDF and ePub downloads, according to the available data) and Abstracts Views on Vision4Press platform.
Data correspond to usage on the plateform after 2015. The current usage metrics is available 48-96 hours after online publication and is updated daily on week days.
Initial download of the metrics may take a while.