Fig. 1
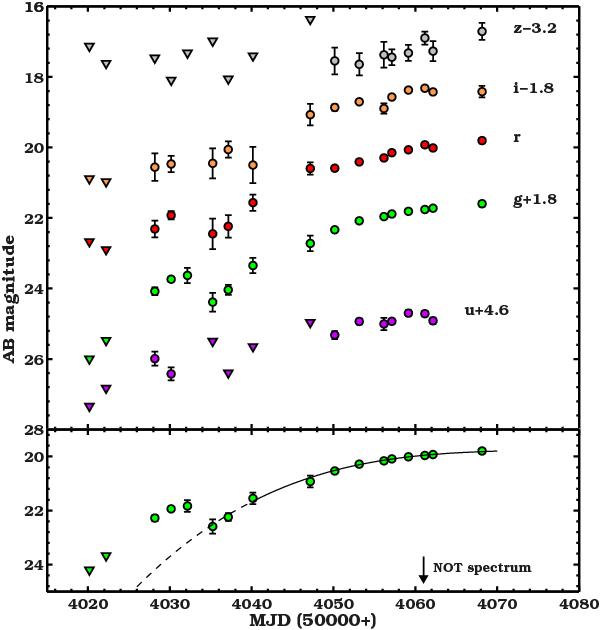
ugriz light curves of SN 2006oz obtained by the SDSS SN Survey, shifted as indicated for presentation purposes. Triangles denote 3σ upper limits. The lower panel focuses on the g-band evolution shown together with a cubic polynomial fit to the last 10 observations (solid line) extrapolated backward (dashed line). Clearly, the first points are strongly inconsistent with a smooth rise. The date of the NOT spectrum is also indicated.
Current usage metrics show cumulative count of Article Views (full-text article views including HTML views, PDF and ePub downloads, according to the available data) and Abstracts Views on Vision4Press platform.
Data correspond to usage on the plateform after 2015. The current usage metrics is available 48-96 hours after online publication and is updated daily on week days.
Initial download of the metrics may take a while.