Free Access
Fig. 5
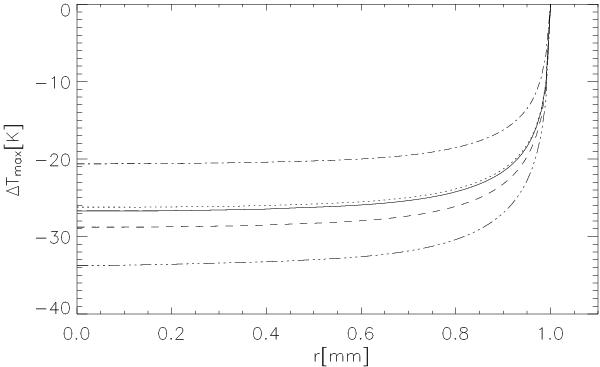
Maximum relative temperature difference within a spherical chondrule as a function of its radius in [mm] for shock waves with Tpeak = 2100 K as summarised in Table 1. solid line: model 6, dotted line: model 7, dashed line: model 8, dash-dot line: model 9, dash-dot-dot line: model 10.
Current usage metrics show cumulative count of Article Views (full-text article views including HTML views, PDF and ePub downloads, according to the available data) and Abstracts Views on Vision4Press platform.
Data correspond to usage on the plateform after 2015. The current usage metrics is available 48-96 hours after online publication and is updated daily on week days.
Initial download of the metrics may take a while.