Fig. 7
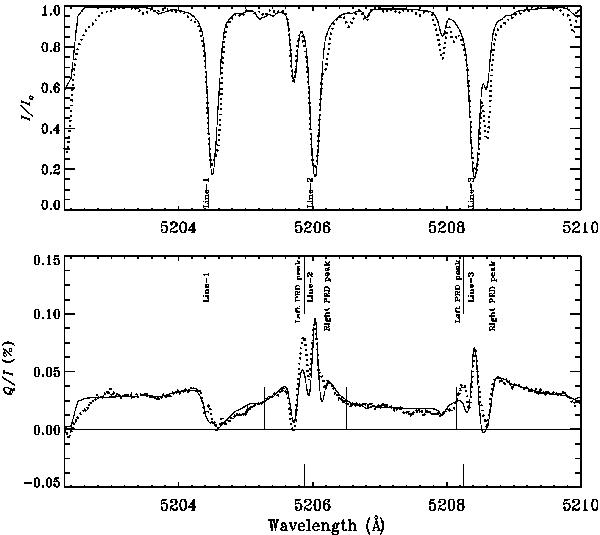
Comparison between the limb (μ = 0.15) observations (dotted line, representing the Q/I spectrum of Fig. 2 averaged along the slit) and the theoretical profile (solid line). The centers of the 3 lines, the PRD peak positions of line-2 and line-3, and the cross-over wavelength positions between the lines are marked with vertical lines. The dashed line in Q/I at 0.025% represents the continuum polarization level. The solid line is the same as the dashed line of Fig. 4a, except that we have now introduced Hanle depolarization due to microturbulent magnetic fields (see Table 1), and added spectral smearing of 80 mÅ to simulate the observations. The smearing wipes out the double-peaked core structure that we see in Fig. 4a.
Current usage metrics show cumulative count of Article Views (full-text article views including HTML views, PDF and ePub downloads, according to the available data) and Abstracts Views on Vision4Press platform.
Data correspond to usage on the plateform after 2015. The current usage metrics is available 48-96 hours after online publication and is updated daily on week days.
Initial download of the metrics may take a while.