Fig. 13
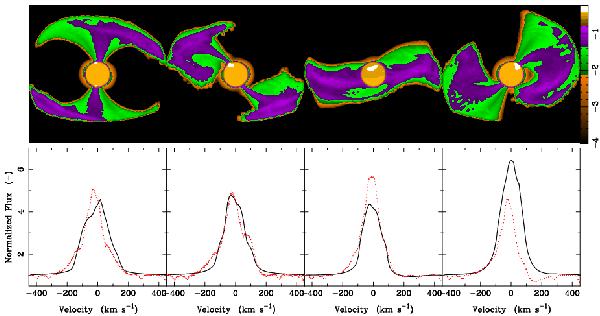
Hα model intensity maps (top panels) and the corresponding profiles (bottom panels, solid lines) computed at rotational phases of 0.0, 0.25, 0.5, and 0.75 (from left to right) for the 3D MHD simulation with a dipole-only magnetic field (see Fig. 12). The intensity maps are shown in the plane perpendicular to our line-of-sight. The parameters used in the simulations are listed in Table 4. The intensity is shown on a logarithmic scale with an arbitrary unit. The model profiles (solid lines) are compared with the observed mean Hα profiles (dotted lines) obtained with HARPS that are presented in Fig. 10. The profiles are normalized to the continuum level.
Current usage metrics show cumulative count of Article Views (full-text article views including HTML views, PDF and ePub downloads, according to the available data) and Abstracts Views on Vision4Press platform.
Data correspond to usage on the plateform after 2015. The current usage metrics is available 48-96 hours after online publication and is updated daily on week days.
Initial download of the metrics may take a while.