Fig. 1
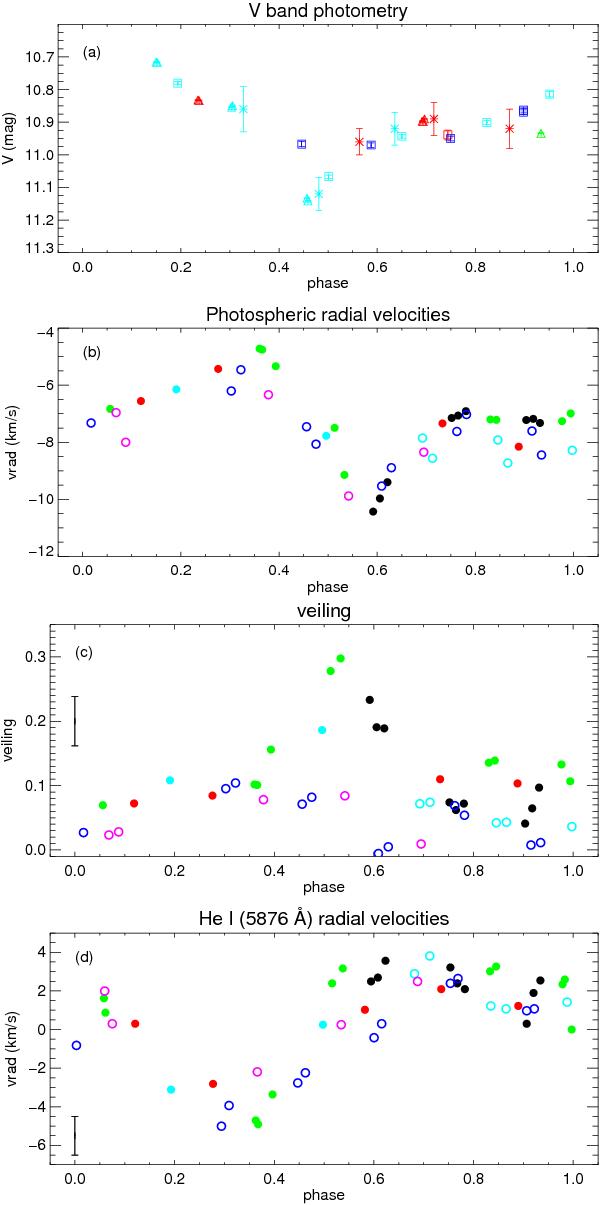
V band photometry corrected from extinction (panel a)). SMARTS data are shown as squares, Palermo data as stars, and Maidanak data as triangles. Photospheric radial velocities (panel b)), veiling (panel c)), and He i (5876 Å) radial velocity (panel d)) phase variations. In panels b)–d), filled symbols are from HARPS data and open ones from ESPaDOnS. The error bars are shown for each observation in panel a), and are smaller than the symbol sizes in panel b). We show in panels c and d only the mean error bars to avoid crowding the figures. Different colors represent different rotational cycles identified as the integer part of the observational phase in Table 1: black – cycle 0, green – cycle 1, red – cycle 2, aqua – cycle 3, dark blue – cycle 4, pink – cycle 5.
Current usage metrics show cumulative count of Article Views (full-text article views including HTML views, PDF and ePub downloads, according to the available data) and Abstracts Views on Vision4Press platform.
Data correspond to usage on the plateform after 2015. The current usage metrics is available 48-96 hours after online publication and is updated daily on week days.
Initial download of the metrics may take a while.