| Issue |
A&A
Volume 541, May 2012
|
|
|---|---|---|
| Article Number | A106 | |
| Number of page(s) | 10 | |
| Section | Extragalactic astronomy | |
| DOI | https://doi.org/10.1051/0004-6361/201118367 | |
| Published online | 10 May 2012 | |
A tidal disruption-like X-ray flare from the quiescent galaxy SDSS J120136.02+300305.5⋆
1 XMM SOC, ESAC, Apartado 78, 28691 Villanueva de la Cañada, Madrid, Spain
e-mail: This email address is being protected from spambots. You need JavaScript enabled to view it.
2 Dept. of Physics and Astronomy, University of Leicester, Leicester LE1 7RH, UK
3 Technische Universität München, Fakultät für Physik, James-Franck-Strasse 1/I, 85748 Garching, Germany
4 Excellence Cluster Universe, TUM, Boltzmannstrasse 2, 85748 Garching, Germany
5 Max Planck Institut für Plasmaphysik, Boltzmannstrasse 2, 85748 Garching, Germany
6 National Astronomical Observatories, Chinese Academy of Sciences, 20A Datun Road, 100012 Beijing, PR China
7 National Research Council, Herzberg Institute of Astrophysics, DRAO, Box 248, Penticton BC, V2A 6J9, Canada
8 Dept of Physics and Astronomy, University of Calgary, 2500 University Dr. NW., Calgary, AB T2N 1N4, Canada
9 Centro de Astrobiología Depto. Astrofisica (INTA-CSIC), ESAC campus, Apartado 78, 28691 Villanueva de la Cañada, Spain
10 Calar Alto Observatory, Centro Astronómico Hispano Alemán, Almería, Spain
Received: 31 October 2011
Accepted: 25 February 2012
Abstract
Aims. The study of tidal disruption flares from galactic nuclei has historically been hampered by a lack of high quality spectral observations taken around the peak of the outburst. Here we introduce the first results from a program designed to identify tidal disruption events at their peak by making near-real-time comparisons of the flux seen in XMM-Newton slew sources with that seen in ROSAT.
Methods. Flaring extragalactic sources, which do not appear to be AGN, are monitored with Swift and XMM-Newton to track their temporal and spectral evolution. Timely optical observations are made to monitor the reaction of circumnuclear material to the X-ray flare.
Results. SDSS J120136.02+300305.5 was detected in an XMM-Newton slew from June 2010 with a flux 56 times higher than an upper limit from ROSAT, corresponding to LX ~ 3 × 1044 erg s-1. It has the optical spectrum of a quiescent galaxy (z = 0.146). Overall the X-ray flux has evolved consistently with the canonical t−5/3 model, expected for returning stellar debris, fading by a factor ~300 over 300 days. In detail the source is very variable and became invisible to Swift between 27 and 48 days after discovery, perhaps due to self-absorption. The X-ray spectrum is soft but is not the expected tail of optically thick thermal emission. It may be fit with a Bremsstrahlung or double-power-law model and is seen to soften with time and declining flux. Optical spectra taken 12 days and 11 months after discovery indicate a deficit of material in the broad line and coronal line regions of this galaxy, while a deep radio non-detection implies that a jet was not launched during this event.
Key words: X-rays: galaxies / galaxies: individual: SDSS J120136.02+300305.5
Partly based on observations collected at the German-Spanish Astronomical Center, Calar Alto, jointly operated by the Max-Planck-institut für Astronomie Heidelberg and the Instituto de Astrofísica de Andalucía (CSIC) and observations made with the WHT operated on the island of La Palma by the Isaac Newton Group in the Spanish Observatorio del Roque de los Muchachos of the Instituto de Astrofísica de Canarias.
Now at Centro de Astrobiología (CSIC-INTA), 28850 Torrejón de Ardoz, Madrid, Spain.
Now at Max-Planck-Institut für Radioastronomie, Auf dem Huegel 69, 53121 Bonn, Germany.
© ESO, 2012
1. Introduction
It has been suggested that the flare of radiation produced by the tidal disruption of a star is a unique signature of the presence of otherwise dormant supermassive black holes (SMBH) in the nuclei of galaxies (e.g., Rees 1988). The accretion of tidally disrupted stellar debris may significantly contribute to the low-luminosity end of the AGN luminosity function (Milosavljevic et al. 2006). To date, several candidate tidal disruption events (TDE) have been identified, based on a luminous flare seen at soft X-ray (e.g., Komossa & Bade 1999; Greiner et al. 2000; Esquej et al. 2007; Cappelluti et al. 2009), UV (e.g., Gezari et al. 2006; Gezari et al. 2008) or optical (e.g., Komossa et al. 2008; Cenko et al. 2012; van Velzen et al. 2011) wavelengths. The first X-ray tidal disruption flares were identified in the course of the ROSAT all-sky survey (Komossa & Bade 1999; Komossa & Greiner 1999; Grupe et al. 1999; Greiner et al. 2000). These events all shared very similar properties, including high peak luminosities and very soft spectra characterised by thermal emission at 40−100 eV, and, in the case of NGC 5905, a decline law scaling approximately as t − 5/3 (see Komossa 2002 for a review). Subsequent XMM-Newton and Chandra observations of these sources, taken 10 years after their discovery showed fading by a factor 200−6000 and a remnant spectrum which had hardened (Halpern et al. 2004; Komossa et al. 2004; Vaughan et al. 2004). The rate of disruption of stellar objects by the central SMBH of a galaxy also has the potential to give much information about stellar dynamics in galactic nuclei. Donley et al. (2002) estimated an X-ray tidal disruption rate of ~10-5 yr-1 galaxy-1 in rough agreement with theoretical predictions (e.g. Magorrian & Tremaine 1999; Wang & Merritt 2004).
Basic TDE theory predicts that debris from the star will fall back to the SMBH, shock against itself and form an optically thick torus of material close to the innermost stable orbit (Rees 1988; Cannizzo et al. 1990). This material will be accreted and replenished at a rate of t−5/3 (Phinney 1989). More recent simulations imply that the initial decrease in flux may be flatter (Lodato et al. 2009) and that the flare could remain close to its peak for many months before tending to a t−5/3 decline.
Optical reprocessing of the X-ray flare from surrounding matter will to first order be similar whether the flare was generated from a TDE or an active galactic nucleus (AGN). Any existing broad line gas will be illuminated within a few days or tens of days. Changes in broad line emission have previously been seen in the active galaxy IC3599 (Brandt et al. 1995; Grupe et al. 1995a) and in the galaxies SDSS J095209.56+214313.3 (Komossa et al. 2008) and SDSS J074820.67+471214.3 (Wang et al. 2011). The coronal line region (CLR) will also be illuminated, dramatically in the case of SDSS J0952+2143, a few months to a few years after the flare.
To investigate the behaviour of the flare around the peak it is necessary to catch one in the act. To this end we have initiated a program to monitor sources found in XMM-Newton slews (Saxton et al. 2008) and compare their flux quickly with that seen in ROSAT. Extragalactic sources, which show a strong increase in flux, and are not known AGN, then become candidates for a follow-up program. Such sources are very rare. We report here on the first fruit from this program; the galaxy SDSS J120136.02+300305.5, observed during an XMM-Newton slew with a flux 56 times greater than the upper limit from the ROSAT all-sky survey (RASS; Voges et al. 1999).
The paper is structured as follows: in Sect. 2 we discuss the flare detection and source identification. In Sect. 3 we review follow-up observations of the optical spectrum, in Sect. 4 we present follow-up X-ray and UV observations and describe the data analysis and in Sect. 5 we detail follow-up radio observations. Section 6 assesses whether the flare characteristics can be explained by an AGN or a TDE and discusses the source properties within the TDE model. The paper is summarised in Sect. 7.
A λCDM cosmology with (ΩM,ΩΛ) = (0.27,0.73) and H0 = 70 km-1 s-1 Mpc-1 has been assumed throughout.
2. X-ray flare identification
During the slew 9192300005, performed on June 10th 2010, XMM-Newton detected a source, XMMSL1 J120135.7+300306, with an EPIC-pn, medium filter, 0.2−2 keV count rate of 2.1 ± 0.5 count s-1. For a typical theoretical tidal disruption spectrum of a black body of temperature 70 eV and the Galactic column for this sky position of 1.4 × 1020 cm-2 (Kaberla et al. 2005), this corresponds to an unabsorbed flux of F0.2 − 2.0 = 3.1 × 10⁻¹² erg s-1 cm-2. We calculate a 2-σ upper limit from the RASS at this position of 0.03 count s-1 (see Esquej et al. 2007 for a description of the upper limit calculation), corresponding to F0.2−2.0 ≤ 5.4 × 10⁻¹⁴ erg s-1 cm-2, using the same spectral model; a factor 56 below the XMM-Newton slew value.
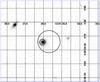 |
Fig. 1 An r-filter image of the galaxy from the SDSS survey, (limiting magnitude r ~ 23), taken on 2004-12-13, shown with the XMM-Newton slew error circle (8 arcsec radius) and UVOT-enhanced Swift error circle (2.1 arcsec radius; see text) centred on the detections. |
The source position was also observed during two earlier slews yielding weak 2-σ upper limits of <0.67 count s-1 in 2003-11-24 and < 1.2 count s-1 in 2007-06-11.
The error on slew source positions is dominated by the systematic error in reconstituting the satellite attitude and has been measured as 8 arcsec (1σ) for an ensemble of sources (Saxton et al. 2008). Within this error circle there is only one catalogued bright source (Fig. 1), SDSS J120136.02+300305.5 (hereafter SDSS J1201+30), with r = 17.93, g = 18.95, u = 20.78, i = 17.50, z = 17.18; a galaxy located at 4 arcseconds from the XMM-Newton position, with a photometric redshift z = 0.128 (SDSS-DR7; Abazajian et al. 2009). This source is coincident with 2MASS 12013602+3003052: J = 16.43 ± 0.11, H = 16.13 ± 0.18, K = 15.43 ± 0.19. The galaxy itself appears to be extended, round, face-on and with little structure.
A crude analysis may be performed on the 19 photons in the slew spectrum to investigate the gross spectral properties of the detection. Detector matrices are calculated, taking into account the transit of the source across the detector, using a technique outlined in Read et al. (2008). The source is soft, with a power-law slope ~3 or black-body temperature ~0.1 keV, assuming no intrinsic absorption above the Galactic value.
3. Optical observations
Director’s time was granted on the 3.5 m/TWIN spectrograph at Calar Alto to observe the source on 2010-06-22, 12 days after the discovery. A 1 h exposure in the red band (5666 − 8801 Å) was made, under photometric conditions with 1.5″ seeing. The resultant spectrum, with a dispersion of 1.6 Å per pixel and signal-to-noise ratio of 15, contains no emission lines (Fig. 2). The absorption lines Mg I λ5167,5173,5184 and Na I λλ5890,5895 can be identified and give a redshift of 0.146 ± 0.001, a little higher than the photometric redshift obtained from the SDSS filters.
A further service-time spectrum was taken on the WHT, using the ISIS spectrograph with the R316R and R300B grisms (Fig. 3). This second spectrum, taken on 2011-05-11, 11 months after the flare, was designed to extend the coverage to blue wavelengths and catch the possible light echo of the flare from circumnuclear material. A spectacular example of this effect was seen in SDSS J0952+2143 (Komossa et al. 2008) where coronal lines were illuminated ~one year after a strong nuclear flare. The exposure time was 30 min giving a signal-to-noise ratio of ~5 in the blue band and 15 in the red band with a dispersion of ~0.8 Å per pixel. Once again no lines were detected in emission. Hα and Hβ are seen in absorption and together with Mg I λ5167,5173,5184, Na I λλ5890,5895, Ca II H and Ca II K absorption lines give a redshift of 0.144 ± 0.002. After modelling and subtraction of an old (11 Gyr) stellar population template (Bruzual & Charlot 2003) no optical emission lines are seen. The [OIII] λ5007 emission may be constrained to F[OIII] ≤ 5 × 10-17 erg s-1 cm-2; L[OIII] ≤ 4 × 1039 erg s-1. From bolometric correction factors of Lamastra et al. (2009) we infer an upper limit to the total luminosity of any persistent emission of Lbol ≤ 3 × 1041 erg s-1.
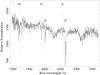 |
Fig. 2 Calar Alto 3.5 m/TWIN spectrum of SDSS J1201+30 taken on 2010-06-22, 12 days after discovery, smoothed by a factor 4. ⊕ denotes the position of the Tellurium atmospheric absorption lines. |
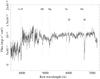 |
Fig. 3 WHT/ISIS spectrum of SDSS J1201+30 taken with the R316R, R300B grisms on 2011-05-11, 11 months after discovery, smoothed by a factor 4. ⊕ denotes the position of the Tellurium atmospheric absorption lines. |
4. X-ray follow-up observations
An X-ray monitoring program was initiated with Swift to follow the evolution of the source flux and spectrum. Snapshot 3 ks observations were made once a week with the Swift-XRT (Burrows et al. 2005) in photon counting mode and the UV optical telescope (UVOT; Roming et al. 2005), using the filter of the day, until the source left the visibility window in August 2010. The Swift-XRT observations have been analysed following the procedure outlined in Evans et al. (2009) and the UVOT data have been reduced as described in Poole et al. (2008). An accurate position for the source in the Swift-XRT field can be determined by matching the UVOT field of view with the USNO-B1 catalogue and registering the XRT field accordingly (Goad et al. 2007). The source is coincident with the galactic nucleus (see Fig. 1). In parallel, a 30 ks XMM-Newton pointed observation was triggered on 2010-06-22 (coeval with the Calar-Alto/Twin optical spectrum) and again on 2010-11-23. The 2010-11-23 observation was strongly affected by radiation and was repeated on 2010-12-23. In each observation the EPIC-pn, MOS-1 and MOS-2 cameras were operated in full frame mode with the thin1 filter in place. The source was too faint for statistically significant data to be collected from the reflection grating spectrometers. The XMM data were analysed with the XMM-Newton Science Analysis System (SAS v11.0.0; Gabriel et al. 2004). Light curves were extracted from the observations and searched for periods of high background flaring. These periods were excluded from further data analysis and the total amount of remaining exposure time is listed in Table 1. Source events were extracted from a circle of radius 25(20) arcseconds for the EPIC-pn, MOS-2 (MOS-1) cameras, using patterns 0 − 4 (EPIC-pn) and patterns 0 − 12 (MOS-1, MOS-2). Background events were extracted from a source-free region on the same CCD. A list of all X-ray observations is given in Table 1.
X-ray observation log of SDSS J1201+30.
4.1. X-ray light curve
In Fig. 4 we show the X-ray light curve for SDSS J1201+30. The source is highly variable, with a factor 50 drop in flux between 2010-06-30 and 2010-07-07. We have superimposed two fiducial decay curves onto the X-ray light curve: a canonical t−5/3 evolution related to the rate of return of tidal debris and a t−5/9 decline which is that predicted for EUV emission from an expanding wind (Strubbe & Quataert 2009). While the strong variations make it impossible to fit a smooth curve through the data points, the overall decay appears to be steeper than the t−5/9 law but not inconsistent with a t−5/3 decline. If the latter is correct, then the source will be emitting at LX ~ 1041−42 erg s-1 for the next 1−2 years and will continue to be visible to XMM-Newton or Chandra. A shallower initial light curve is predicted by detailed modelling of the stellar internal density (Lodato et al. 2009). With the strong observed variability it is impossible to say what the shape of the underlying early-phase intrinsic light curve was in this case. Qualitatively the light curve bears a striking resemblance to that of SWIFT J164449.3+573451 (Burrows et al. 2011), which shows variations by up to two decades in flux over a few days, superimposed on a gradual downward trend. In that case the emission is believed to be caused by a relativistic jet which has been instantiated by the sudden accretion of material from a tidally disrupted star.
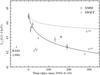 |
Fig. 4 The 0.2−2 keV X-ray light curve of SDSS J1201+30. XMM-Newton slew and pointed observations: circle, Swift-XRT: cross. All upper limits are from Swift except the RASS point. The latest upper limit point is calculated by combining the last three Swift observations from 2011-03-25, 2011-04-01 and 2011-04-11. The lines represent t−5/3 (solid) and t−5/9 (dotted) declines. |
4.1.1. Short-term X-ray variability
The first XMM-Newton pointed observation was analysed to search for rapid variability. A 0.16−1 keV light curve was extracted and binned into 400 second time bins. The light curve was exposure corrected and background subtracted using the XMM-SAS task epiclccorr. A K-S test on the EPIC-pn light curve (Fig. 5) gives a probability of the source being variable of 98.7%. The shortest variability scale is ~4000 s with an amplitude of ~50%, which can be seen from 6−10 ks in Fig. 5. The second XMM-Newton pointed observation shows similar variability albeit with less statistical significance.
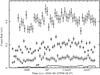 |
Fig. 5 The background-subtracted, exposure corrected, EPIC-pn (top), MOS-1 (middle) and MOS-2 (next to bottom) 0.16 − 1.0 keV light curves from the first XMM-Newton pointed observation of 2010-06-22, together with the exposure corrected, EPIC-pn background (bottom), which reaches a maximum of 0.022 count s-1. The MOS-1 curve is scaled by a factor 2.5 for ease of viewing. |
4.2. UV light curve
During the three pointed XMM-Newton observations, the optical monitor (OM) cycled between the U, UVW1 and UVM2 filters. Swift-UVOT observations were performed with the filter of the day; once with the uv filter and otherwise with the uvw1, uvw2 and uvm2 filters in place. The galaxy is faint at UV wavelengths and was only detected in the XMM-U, Swift-uv and XMM-UVW1 filters. The XMM-U (3480 Å) and XMM-UVW1 (2950 Å) fluxes are constant between the observations (Table 2). We can place a 2-σ upper limit on any decrease in the XMM-U count rate between the 2010-06-22 and 2010-12-23 XMM-Newton observations of 0.025 count s-1. The low UV flux argues against the galaxy containing a significant young stellar population.
XMM-Newton optical monitor UV measurements of SDSS J1201+30.
4.3. X-ray spectrum
Despite the factor 100 drop in count rate between the XMM-Newton slew observation and the XMM-Newton pointed observation of 2010-12-23, taken 190 days later, there is little change in the shape of the spectrum (Fig. 6).
Spectra were produced for the three EPIC cameras from the 2010-06-22 XMM-Newton observation and fit with XSPEC (version 12.6.0). Fits were performed simultaneously on the ungrouped spectra, using the Cash statistic (Cash 1979), over the energy range 0.2 − 2 keV, using a constant to account for the small differences in normalisation between the instruments.
The overall spectrum is relatively broad and can not be modelled with a black body or disc black body model (diskbb in xspec; Table 3). A power-law does not fit the data well, either using extra intrinsic neutral or ionised absorption or an additional soft component. The spectral shape is modelled reasonably well by either a Bremsstrahlung of temperature kT = 390 eV (C/d.o.f. = 1.07) or a broken power-law model (C/d.o.f. = 1.04) if an edge is included at an energy of ~0.66 keV in the source rest frame (Fig. 7). The observed edge energy is roughly that of neutral Oxygen at zero redshift. It is possible that there could be an excess of Oxygen in the line of sight in our galaxy but it would need to have an abundance 5 times higher than solar. We note that the spectra show no evidence for line emission. If an APEC model, with kT = 390 eV, is fitted then the elemental abundances are limited to 0.5% of the solar values.
The XMM-Newton pointed observations of 2010-11-23 and 2010-12-23 were analysed in the same way. EPIC spectra produced from the 2010-11-23 observation are fit well with a Bremsstrahlung of temperature kT = 290 eV. There is no requirement for extra absorption, although formally the edge seen in the first observation at 655 eV with τ = 0.3 is not excluded. The 2010-12-23 observation (EPIC-pn only) may be fit with a Bremsstrahlung of kT = 180 eV and again an edge does not improve the fit. A broken power-law model is also acceptable for these two observations.
The Swift-XRT observations of 2010-06-20 and 2010-06-30 have low statistics but may be used to constrain the Bremsstrahlung temperature or the Γ for a power-law fit. The observation of 2010-06-30 has the hardest spectrum of all.
The best fit flux from the XMM-Newton slew observation is  erg s-1cm-2 corresponding to
  erg s-1 . Extrapolating over the EUV band gives a bolometric luminosity of Lbol = 5 − 14 × 1044 erg s-1.
The spectrum is seen to get softer as the flux declines (Fig. 8). The same evolution was seen in the spectrum of SWIFT J164449.3+573451 which also softens with decreasing flux (Burrows et al. 2011). This differs from previous TDE flares which showed a spectral hardening with time in observations of candidates taken several years after the peak of the event (Halpern et al. 2004; Komossa et al. 2004; Vaughan et al. 2004). This may be telling us that the later emission (after ~ 2 years) is caused by a different process, for example accretion from a slim disc. A summary of fit parameters is presented in Table 3.
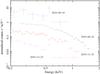 |
Fig. 6 XMM-Newton, EPIC-pn spectra of SDSS J1201+30 from the slew survey (medium filter) and the three pointed observations (thin1 filter). |
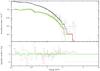 |
Fig. 7 A fit to the XMM-Newton EPIC-pn (black), MOS-1 (red / grey) and MOS-2 (green / light grey) spectra of SDSS J1201+30 from the 2010-06-22 observation with a rest-frame model of a Bremsstrahlung of kT = 390 eV and an edge at 660 eV. |
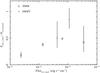 |
Fig. 8 The 0.6−1.2 keV to 0.3−0.6 keV flux ratio as a function of the (absorbed) soft X-ray (0.2−2 keV) flux for observations with sufficient statistics to constrain the flux ratio. |
Spectral fits to XMM-Newton and Swift observations of SDSS J1201+30.
5. Radio observations
A search for radio emission associated with SDSSJ1201+30 was made on 2011-09-15 with the NRAO Very Large Array (VLA) in New Mexico, USA using Director’s Discretionary Time. Observations were completed at 1.388 (L band), 4.832 (C band) and 8.332 GHz (X band), using 256 MHz of bandwidth. Observations of the target were made between observations of the nearby phase-reference calibrator J1207+2754. The flux scale was established by an observation of J1331+305 (3C 286).
Editing, calibration, imaging, deconvolution and analysis were completed using the NRAO AIPS software package. The fluxes established for J1207+2754 were 0.452, 0.357, and 0.352 Jy at 1.4, 4.8 and 8.3 GHz respectively. Images at each frequency were made of an area extending at least 30 arcsec around the coordinates of SDSS J1201+30, and weighted in order to increase the detection sensitivity of the imaging. No emission was detected at the location of SDSS J1201+30, leading to 3σ upper limits on the radio flux of 201,135 and 108 μJy at 1.4, 4.8 and 8.3 GHz respectively.
The radio measurements of SDSS J1201+30 are plotted in Fig. 9 together with multi-wavelength observations.
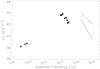 |
Fig. 9 The spectral energy distribution of SDSS J1201+30, consisting of VLA 3-sigma upper limits, extinction corrected 2MASS and WHT data, UV data from the XMM-Newton OM (2010-06-22) and a power-law fit to the XMM-Newton X-ray data of 2010-06-22 (upper solid line) and 2010-12-23 (lower solid line). |
6. Discussion
6.1. High-amplitude variability of AGN
Before we model in detail the spectral and temporal evolution of this extragalactic flare we need to assess whether it has been caused by a stellar disruption, an AGN event or a combination of the two.
X-ray variability by a factor > 100 is very rare in AGN but has been detected in a few cases, so the amplitude of variability alone can not distinguish between the two scenarios in the case of SDSS J1201+30.
Below, we briefly summarise the characteristics of high variability AGN, and of some previously detected TDEs. In the next Section, we then compare them with SDSS J1201+30.
Variability of AGN by factors of a few to 20 is not uncommon, and is typically traced back to changes in the line-of-sight (cold or ionised) absorption (e.g., Risaliti et al. 2005), or can be caused by emission and reflection mechanisms (e.g., Fabian et al. 2012). In rare cases, this variability has been semi-periodic (Otani et al. 1996; Boller et al. 1997). Semi-periodicity is also predicted from periodic interaction of a compact object with the accretion disc, which can cause recurrent flares in AGN. Large thermal Bremsstrahlung flares seen at optical wavelengths in OJ 287 may be caused by a secondary massive black hole passing through the accretion disc of the primary (Lehto & Valtonen 1996).
Variability exceeding a factor of ~100 is very rare in AGN, but has occasionally been seen. X-ray emission from the narrow-line Seyfert I galaxy (NLS1) WPVS007 dimmed by a factor 400 between 1990 and 1993 (Grupe et al. 1995b), and has been faint ever since (Grupe et al. 2008). Subsequent observations with FUSE revealed the development of a strong BAL outflow (Leighly et al. 2009) which led Grupe et al. (2008) to conclude that the strong X-ray variability and very soft spectrum are caused by variations in a highly-ionised absorber. Another NLS1, PHL 1092, dropped in flux by a factor 200, while maintaining roughly the same spectrum, interpreted as a reduction in the comptonising medium (Miniutti et al. 2009). GSN 069, a low-luminosity Seyfert II, increased in flux by a factor 200 over 10 years, giving a very soft, apparently thermal, spectrum, which was interpreted as a transition in the disc state by Saxton et al. (2011).
All these objects are shown to be persistent AGN by the strong narrow emission lines in their optical spectra.
The crucial arguments for why TDE candidates differ fundamentally from the above high-variability AGN have been laid out before (notably in Komossa & Bade 1999; Komossa 2002; and Gezari et al. 2009) but are worth examining again in the light of recent results.
-
The absence of narrow lines in the optical spectrum. Limits on thebolometric luminosity of any persistent AGN emission can beinferred from the strength of the narrow emission lines, notably[OIII] (e.g. Lamastra et al. 2009), which gives theaverage Lbol seen by the NLR over the last ~104 years and so is unaffected by temporary rises or drops in the accretion rate or line-of-sight absorption. On a note of caution, the emergence of a subclass of AGN which are X-ray bright but show no optical features (XBONGs; Comastri et al. 2002) means that very rare examples of AGN without optical emission lines do exist. Trump et al. (2009) discuss a sample of 48 XBONGs from the COSMOS survey and show that thirteen have anomalously weak narrow ionisation lines given their bolometric flux. They suggest that these AGN may be weakly accreting from a truncated accretion disc. Another explanation for at least some XBONGs has been the dominance of a host galaxy outshining faint emission features. While the physical nature of some XBONGs is still unclear, to our knowledge no XBONG has yet been seen to display strong X-ray variability and so the chance of a highly-variable AGN, which is also an XBONG, being mistaken for a TDE is small. Blazars also show rapid variability and weak emission lines and could in principle be mistaken for TDE. They can usually be recognised by their characteristic radio emission and radio-to-optical spectral index and have been successfully excluded in interpretations of previous events (e.g. Gezari et al. 2009; Cenko et al. 2012).
-
The X-ray flux should be dominated by the availability of accretable material and should fall over the long-term as t−5/3. Recent numerical simulations show that while the initial decline depends on a number of factors, the trend should tend to t−5/3 within ~1 year. There is no reason why variable absorption or disc state transitions should follow this law.
-
The X-ray emission should continue to fall until it reaches levels below those of even nearby classical AGN and should not rise again on human timescales1.
It is the combination of these three tests which makes the TDE interpretation so strong for a small number of ROSAT detected candidates. NGC 5905 was optically consistent with an HII galaxy from ground-based observations (Komossa & Bade 1999) while with HST, a low-luminosity [OIII] emission line (Gezari et al. 2003), conceivably induced by the flare, was detected. The decline in flux of NGC 5905 fits well to a t − 5/3 curve (Komossa & Bade 1999) and monitoring over 11 years shows LX falling below 1039 erg s-1 to a level where the remaining emission is probably due to starburst activity (Halpern et al. 2004).
Finally, it should also be noted that the disruption of a star by a SMBH with a pre-existing accretion disc, may actually be more frequent than a disruption by a naked SMBH (Karas & Subr 2007). However, it would be very difficult to unambiguously identify such an event using the above conditions. A case in point is that of IC 3599 (Brandt et al. 1995; Grupe et al. 1995a).
6.2. Could the flare of SDSS J1201+30 be an AGN event ?
First, we note, that in neither of our two optical spectra did we actually detect any emission lines which indicate the presence of a permanent AGN. From the WHT spectrum we infer Lbol ≤ 3 × 1041 erg s-1 for any persistent AGN activity and Lbol = 5 − 14 × 1044 erg s-1 during the XMM-Newton slew observation. For this flux change to be due to variable absorption a change in column of ΔNH > 1023 cm-2 would be needed for a neutral absorber and somewhat larger for an ionised absorber. If variable absorption was the sole cause of the flux variations seen in the X-ray light curve, then a strong imprint of absorption would be seen in the 2010-12-23 XMM-Newton observation. Evidence of strong absorption is not seen and so we can exclude absorption effects as the primary cause of the flux variations. And, again, if we only had line-of-sight absorption, the narrow emission lines should still be present in the optical spectrum. A situation, where a thick neutral absorber has completely shielded the whole NLR in all directions for the last millenia, but has now opened a tiny hole, for a temporary, partially covered, glimpse into the central engine, appears highly contrived. Neither does it explain the peculiar X-ray spectrum that we observe (which is unlike any classical AGN), nor should it mimic the lightcurve decline law expected from a TDE. Similar arguments have been given for the case of NGC 5905 and other TDEs before.
From the relationship of black hole mass to bulge K-band luminosity (Marconi & Hunt 2003) we find 3 × 10⁵ < MBH < 2 × 10⁷ M⊙ in the case of SDSS J1201+30, where the range indicates the uncertainty in the galaxy type and hence the contribution of star formation to the K band flux. The UV flux and template fits to the optical spectra imply that there is little recent star formation in the galaxy, which in turn implies that the source resides in an early-type host galaxy, where the K-band luminosity will be dominated by disc emission. For this reason we prefer the higher value of MBH = 2 × 10⁷ M⊙ with an error from the correlation of 0.3 dex.
From the peak bolometric luminosity of Lbol = 5−14 × 1044 erg s-1 and using Ledd = 1.3 × 1044 M6 erg s-1, (where M6 is the black hole mass in units of 106 M⊙), we find an Eddington ratio at the time of the XMM-Newton slew observation of 0.2−33 and < 10-4 − 10-2 for any persistent emission. This would then imply that the AGN had undergone a sudden change from an inefficient accretion state (e.g. advection dominated accretion flow [ADAF]; Narayan & Yi 1994) to an efficient state (e.g. slim disc; Shakura et al. 1973) and had then returned to the inefficient state over ~1 year.
6.3. Could SDSS J1201+30 be a blazar or have jet emission?
The strong limits on radio emission, discussed in Sect. 5, effectively preclude the presence of a strong jet in SDSS J1201+30. The radio-to-optical spectral index αRO = −log (fν,R/fν,O/log (νR/νO) < 0.14, where the radio is taken at 1.4 GHz and the optical from the WHT spectrum at 4400 Å, is below the minimum value of αRO = 0.2 associated with the blazar population (Beckmann et al. 2003). In this regard SDSS J1201+30 is very different from SWIFT J164449.3+573451 where an on-axis jet appears to dominate the radio (Zauderer et al. 2011; Berger et al. 2012) and X-ray (Burrows et al. 2011; Bloom et al. 2011) emission. If an off-axis jet is launched by the accretion of tidally disrupted material then it should radiate strongly in the radio band when it interacts with the interstellar medium and a reverse shock is formed (Giannios & Metzger 2011). The radio emission is predicted to peak after ~ 1 year, at ν = 25 GHz, with a flux of ~2 (D/GPc)-2 mJy. At the distance of SDSS J1201+30 (700 Mpc) the predicted fluxes at 1.4, 4.8 and 8.3 GHz are 0.4, 2.2 and 2.8 mJy respectively. The SDSS J1201+30 3-σ upper limits taken 16 months after discovery are a factor 2, 16 and 26 below these values. This suggests that a jet was not launched during this event.
6.4. Tidal disruption
The gradual decline of the X-ray emission, albeit with large excursions, and the relatively constant spectral shape are arguments in favour of a supply of material which is being exhausted at the predicted rate of t−5/3 (Phinney 1989). Lodato et al. (2009) predicted that the decline in flux would depend on the internal state of the star, and would usually be more gradual initially, tending to t−5/3 only after several months. With the strong variations seen in this lightcurve it is impossible to distinguish between the two models2.
The light curve resembles that of SWIFT J164449.3+ 573451, suffering continual strong variability on a timescale of days. In SWIFT J164449.3+573451 this has been ascribed to the precession of a relativistic jet which has been switched on by a TDE (Burrows et al. 2011). Here we need to search for a different mechanism involving flaring and/or absorption processes. The rate of return of tidal debris is likely to be irregular and an accretion structure formed from this material may well exhibit X-ray variability in excess of that seen from established AGN accretion discs.
The X-ray spectrum of SDSS J1201+30 is not the thermal radiation expected in the early stages of a disruption, if the density is sufficient to thermalise the photons (Rees 1988) and neither is it the typical signature of an accretion disc, seen in the late stages of several other TDE candidates (Komossa et al. 2004; Vaughan et al. 2004; Esquej et al. 2008). It is best fit with a Bremsstrahlung or broken power-law model which becomes softer with time and/or reducing flux.
Where is the thermal component?
The expectation was that TDEs would, at least initially, have a purely thermal spectrum, either from a thin disc (Cannizzo et al. 1990) or a thick disc (Ulmer 1999). The effective temperature (Teff) of the emission will be mainly dependent upon the inner radius assumed in the disc configuration. For Eddington-limited, thick-disc accretion, Ulmer 1999 showed that  eV. In the thin-disc case
  eV while if the debris forms at the tidal disruption radius then
  eV (Komossa 2002). Thermal emission, from the inner edge of the accretion disc, should also exist in persistent AGN. Very rarely it can be seen if the AGN has a small BH mass and lacks a comptonisation region; e.g., RX J1633+4718 (Yuan et al. 2010) and GSN 069 (Saxton et al. 2011).
Although most of the previous X-ray selected TDE candidates have shown soft X-ray spectra, none of the observations, at the peak of the disruption, have had sufficient spectral resolution and statistics to conclusively constrain the spectral model. In the XMM-Newton observation of 2010-06-22, which appears to be close in time to the peak of the flare, we ought to see black-body emission with a temperature of a few tens of eV and L ~ 1044 M6 erg s-1 (Rees 1988). Such emission is not obviously present in the spectrum that we observe. A lower limit on the temperature of a putative black-body component can be found from the UV flux. From the upper limit to the difference in the U filter flux between the 2010-06-22 and 2010-12-23 XMM-Newton pointed observations (0.025 count s-1), a Lbol = 1044 erg s-1 black-body component must have kT > 29 eV. From X-ray spectral fits we can put a limit of F0.2−2 < 2.4 × 10⁻¹³ erg s-1cm-2 on an additional soft component in the 2010-06-22 XMM-Newton pointed observation. In Fig. 10 we show that the UV and X-ray results together constrain the bolometric luminosity of any optically thick thermal emission to Lbb ≤ 1044 erg s-1, even if the peak of the emission lies in the EUV band, during the 2010-06-22 observation.
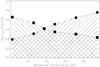 |
Fig. 10 Limits on the bolometric luminosity of blackbody emission from SDSS J1201+30 during the observation of 2010-06-22. Filled squares represent limits from soft X-ray fits while filed circles give the limits from the UV emission. The cross-hatched area shows the allowable Lbol as a function of the rest frame blackbody temperature. |
Absorption mechanisms:
The strong decrease in flux between 20 and 40 days after discovery (Fig. 4) may be due to absorption by line of sight material. As a guide, the observed flux drop between the Swift observations of 2010-06-30 and 2010-07-07 requires a neutral absorber with NH > 5 × 1022 cm-2. A possible source of this absorption could be material driven from the system by radiation pressure during an early super-Eddington accretion phase (Strubbe & Quataert 2009). This is calculated to produce soft X-ray absorption with an attenuation which is dependent on MBH and the expansion velocity (Strubbe & Quataert 2011) and timescales broadly compatible with those that we see in SDSS J1201+30, i.e. apparently strong absorption starting after 20 − 30 days which has greatly reduced after 130 days. The expanding envelope would itself, however, emit thermally with Lbol ~ 1044  erg s-1 and a temperature of ~ 10 − 20 eV. This is not really compatible with the limits on thermal emission discussed in the previous section. We note that the optical emission from the envelope, Lopt ~ 1041 − 43 erg s-1 would not necessarily be detectable in this case against the background emission from the galaxy.
Another possible source of absorbing material is the non-bound stellar debris (Khokhlov & Melia 1996), even though a special viewing angle is required in this case.
What are we seeing?
While we clearly aren’t observing optically thick thermal radiation, the 2010-06-22 XMM-Newton pointed spectrum is well fit with optically thin emission at a temperature of kT ~ 390 eV. Emission at this temperature should produce strong emission lines from OVII, OVIII, NVI and NVII. No lines are seen and a fit with an APEC model gives an upper limit to the metal abundance of 0.5% of solar values. This effectively rules out the possibility that we are observing emission from debris heated as it falls back and before it circularises. Khokhlov & Melia (1996) predict that unbound disrupted material will be expelled from the system in a fan-like shape at high velocity. X-rays are created when this collimated beam shocks against circumnuclear material. The resulting spectrum should be much like that of an extremely energetic supernova remnant, typically modelled as a vpshock model. This model doesn’t fit well, as it also overpredicts line strengths. Also it is not clear why the emission from the shock would effectively turn off after 20 days.
If the returning material quickly settles into an accretion disc (Cannizzo et al. 1990; Ulmer 1999) then the X-ray spectrum could be due to some form of comptonisation of thermal photons by hot electrons. Nevertheless, this would have to occur without the optical and/or UV flux increasing significantly.
While the absence of radio emission in SDSS J1201+30 makes it unlikely that it shares the same emission mechanism as SWIFT J164449.3+573451, the similarities in the light curves are intriguing. In fact the relationship of the spectral hardness with X-ray flux (Fig. 8) goes in the same direction in the two sources. In Fig. 11 we compare the evolution of the X-ray spectral hardness (as parameterised by the power-law slope) with X-ray luminosity for SDSS J1201+30 and SWIFT J164449.3+573451 and compare it with a selection of earlier TDE candidates in the early peak phase of their emission.
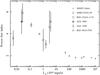 |
Fig. 11 The spectral slope of a single power-law, absorbed by the galactic column and intrinsic absorption, plotted against X-ray luminosity: SWIFT J164449.3+573451 (Burrows et al. 2011), SDSS J1201+30 and NGC 3599 (this work), NGC 5905 (Bade et al. 1996), RXJ 1242.6-1119 (Komossa & Greiner 1999; this fit only uses Galactic absorption), RXJ 1624+7554 (Grupe et al. 1999). |
6.5. Reprocessed optical radiation
The two optical observations allow constraints to be placed on the amount of reprocessing material in the vicinity of the SMBH. The intense radiation from the peak of the flare will naturally be reprocessed by the stellar debris; predictions give an Hα line, which is broad and variable on timescales of hours to days, with a luminosity of < 1037−39 erg s-1 (Bogdanovic et al. 2004). The Calar-Alto/TWIN spectrum, taken 12 days after discovery, has an Hα limit LHα < 1039 erg s-1, and so we are not sensitive to these broad lines for sources with spectra like SDSS J1201+30 (note its Hydrogen absorption features in the optical spectrum) for 1 h exposures on a 4 m class telescope.
If the source were an AGN with a persistent luminosity of Lbol < 3 × 1041 erg s-1 then the radius of the BLR would be 1 − 2 light days (Bentz et al. 2009) and the optical spectrum of 2010-06-22 should show strong broad lines from this region. In practise an AGN appears to need a minimum strength Lbol > 1042 erg s-1 to produce a BLR (Nicastro 2000) and so we would perhaps not expect to see broad optical lines in this case.
The WHT observation in May 2011 probed a light cone which can be approximated by a wave front 1−2 light months wide (when the source was near its peak) lasting from June to July 2010. We will see reprocessing in the WHT observation from material at 5−11 light months distance from the nucleus. For MBH ~ 107 M⊙, 5−11 light months corresponds to the coronal line region. A close analogy to this situation was found in SDSS J0952+2143 (Komossa et al. 2009) where very strong (L ~ 1040 erg s-1) emission was seen from FeVII, FeX, FeXI and FeXIV. In that case the unseen X-ray flare was calculated to have parameters similar to the ones seen in SDSS J1201+30; LX ~ 1044 erg s-1 and MBH ~ 107 M⊙. A key factor in the production of coronal lines is the soft X-ray flux although the line strength will also depend on the UV continuum. While detailed modelling is beyond the scope of this paper, we note that the typical CLR line luminosity is ≈ 0.1% of the observed X-ray luminosity in AGN (Nagao et al. 2000). We might therefore expect to see Fe line strengths of LFe ~ 1040−41 erg s-1. The limits on emission from these narrow lines in the WHT observation are LFe < 1039 erg s-1 suggesting that the total mass of flourescing material in the CLR of SDSS J1201+30 is < 10% of that of a typical AGN or that of SDSS J0952+2143.
7. Summary
A soft X-ray flare was seen in an XMM-Newton slew observation of the galaxy SDSS J1201+30 in June 2010 with an implied Lbol = 5−14 × 1044 erg s-1. The galaxy shows no evidence for previous AGN activity. Together with the absence of strong intrinsic absorption in subsequent X-ray observations, this makes it unlikely that the flare is due to a change in line-of-sight obscuring material towards a persistent AGN. Large variability, on timescales of a week, is apparent in the light curve but the general downward trend, over a year, is not inconsistent with the reduction in accretable material expected from the disruption of a stellar object by a SMBH.
The strong variability seen in the light curve is likely due to a combination of flaring and absorption events, perhaps related to clumpy accretion. The X-ray spectrum is not that of optically thick thermal emission or that of a typical accretion disc. It can be modelled by Bremsstrahlung or a double power-law, which becomes softer as the flux decreases.
Optical spectra indicate an absence of material in the BLR and CLR of the nucleus of this galaxy. Deep radio upper limits imply that a jet was not launched during this event.
This first result shows that a monitoring program with Swift and XMM-Newton of flaring extragalactic sources is capable of producing X-ray light curves and spectra of high quality, which in this case are not simply explained by current models.
Note, however, the possibility of repeat tidal disruptions on the timescales of years or centuries, if the SMBH at the galaxy core is a binary (Chen et al. 2009), or if the SMBH is off-centre due to gravitational wave recoil (Komossa & Merritt 2008).
Together with SWIFT J164449.3+573451 and SWIFT J2058.4+ 0516 (Cenko et al. 2011) this is the best sampled X-ray light curve of a TDE candidate made to date. Earlier works have not made the critical observations in the weeks and months following the flare detection.
Acknowledgments
Funding for the SDSS and SDSS-II has been provided by the Alfred P. Sloan Foundation, the Participating Institutions, the National Science Foundation, the US Department of Energy, the National Aeronautics and Space Administration, the Japanese Monbukagakusho, the Max Planck Society, and the Higher Education Funding Council for England. The SDSS Web Site is http://www.sdss.org/. The National Radio Astronomy Observatory is a facility of the National Science Foundation operated under cooperative agreement by Associated Universities, Inc. We thank Calar Alto Observatory and NRAO for allocation of director’s discretionary time to this programme. This research has been funded by Spanish grants AYA 2010-21161-C02-02, CDS2006-00070 and PRICIT-S2009/ESP-1496. We thank the XMM OTAC for approving this program. The XMM-Newton project is an ESA science mission with instruments and contributions directly funded by ESA member states and the USA (NASA). The XMM-Newton project is supported by the Bundesministerium für Wirtschaft und Technologie/Deutches Zentrum für Luft- und Raumfahrt i (BMWI/DLR, FKZ 50 OX 0001), the Max-Planck Society and the Heidenhain-Stiftung. We thank the Swift team for approving and performing the monitoring observations. This work made use of data supplied by the UK Swift Science Data Centre at the University of Leicester. A.M.R. acknowledges the support of STFC/UKSA/ESA funding.
References
- Abazajian, K., Adelman-McCarthy, J., Agüeros, M., et al. 2009, ApJS, 182, 543 [NASA ADS] [CrossRef] [Google Scholar]
- Bade, N., Komossa, S., & Dahlem, M. 1996, A&A, 309, L35 [NASA ADS] [Google Scholar]
- Beckmann, V., Engels, D., Bade, N., & Wucknitz, O. 2003, A&A, 401, 927 [NASA ADS] [CrossRef] [EDP Sciences] [Google Scholar]
- Bentz, M., Peterson, B., Pogge, R., & Vestergaard, M. 2009, ApJ, 694, L166 [NASA ADS] [CrossRef] [Google Scholar]
- Berger, E., Zauderer, A., Pooley, G., et al. 2012, ApJ, 748, 36 [NASA ADS] [CrossRef] [Google Scholar]
- Bogdanovic, T, Eracleous, M., Mahadevan, S., Sigurdsson, S., & Laguna, P. 2004, ApJ, 610, 707 [NASA ADS] [CrossRef] [Google Scholar]
- Boller, Th., Brandt, W., Fabian, A. C., & Fink, H. 2007, MNRAS, 289, 393 [Google Scholar]
- Brandt, W., Pounds, K., & Fink, H., 1995, MNRAS 273, L47 [Google Scholar]
- Bloom, J., Giannios, D., Metzger, B. D., et al. 2011, Science, 333, 203 [CrossRef] [PubMed] [Google Scholar]
- Bruzual, G., & Charlot, S. 2003, MNRAS, 344, 1000 [NASA ADS] [CrossRef] [Google Scholar]
- Burrows, D., Hill, J., Nousek, J., et al. 2005, Space Sci. Rev., 120, 165 [NASA ADS] [CrossRef] [Google Scholar]
- Burrows, D., Kennea, J., Ghisellini, G., et al. 2011, Nature, 476, 421 [NASA ADS] [CrossRef] [PubMed] [Google Scholar]
- Cannizzo, J., Lee, H., & Goodman, J. 1990, ApJ, 351, 38 [NASA ADS] [CrossRef] [Google Scholar]
- Cappelluti, N., Ajello, M., Rebusco, P., et al. 2009, A&A, 495, L9 [Google Scholar]
- Cash, W. 1979, ApJ, 228, 939 [NASA ADS] [CrossRef] [Google Scholar]
- Cenko, S., Krimm, H., Horesh, A., et al. 2011, ApJ, submitted [arXiv:1107.5307] [Google Scholar]
- Cenko, S., Bloom, J., Kulkarni, S., et al. 2012, MNRAS, 420, 2684 [NASA ADS] [CrossRef] [Google Scholar]
- Chen, X., Madau, P., Sesana, A., & Liu, F. 2009, ApJ, 697, L149 [NASA ADS] [CrossRef] [Google Scholar]
- Comastri, A., Mignoli, M., Ciliegi, P., et al. 2002, ApJ, 571, 771 [NASA ADS] [CrossRef] [Google Scholar]
- Donley, J., Brandt, W., Eracleous, M., & Boller, Th. 2002, AJ, 124, 1308 [NASA ADS] [CrossRef] [Google Scholar]
- Esquej, P., Saxton, R., Freyberg, M., et al. 2007, A&A, 462, L49 [NASA ADS] [CrossRef] [EDP Sciences] [Google Scholar]
- Esquej, P., Saxton, R. D., Komossa, S., Read, A. M., & Freyberg, M. J., 2008, A&A, 489, 543 [NASA ADS] [CrossRef] [EDP Sciences] [Google Scholar]
- Evans, P., Beardmore, A., Page, K., et al. 2009, MNRAS, 397, 1177 [NASA ADS] [CrossRef] [Google Scholar]
- Fabian, A., Zoghbi, A., Wilkins, D., et al. 2012, MNRAS, 419, 116 [NASA ADS] [CrossRef] [Google Scholar]
- Gabriel, C., Denby, M., Fyfe, D., et al. 2004, In ADASS Xiii, ed. F. Oschenbein, M. Allen, & D. Egret, ASP Conf. Ser., 314, 759 [Google Scholar]
- Gezari, S., Halpern, J., Komossa, S., Grupe, D., & Leighly, K. 2003, ApJ, 592, 42 [NASA ADS] [CrossRef] [Google Scholar]
- Gezari, S., Martin, D., Milliard, B., et al. 2006, ApJ, 653, L25 [NASA ADS] [CrossRef] [Google Scholar]
- Gezari, S., Basa, S., Martin, D., et al. 2008, ApJ, 676, 944 [NASA ADS] [CrossRef] [Google Scholar]
- Gezari, S., Heckman, T., Cenko, S., et al. 2009, ApJ, 698, 1367 [NASA ADS] [CrossRef] [Google Scholar]
- Giannios, D., & Metzger, B. 2011, MNRAS, 416, 2102 [NASA ADS] [CrossRef] [Google Scholar]
- Goad, M., Tyler, L., Beardmore, A., et al. 2007, A&A, 476, 1401 [NASA ADS] [CrossRef] [EDP Sciences] [Google Scholar]
- Greiner, J., Schwarz, R., Zharikov, S., & Orio, M. 2000, A&A, 362, L25 [NASA ADS] [Google Scholar]
- Grupe, D., Beuerman, K., Mannheim, K., et al. 1995a, A&A, 299, L51 [Google Scholar]
- Grupe, D., Beuerman, K., Mannheim, K., et al. 1995b, A&A, 300, L21 [NASA ADS] [Google Scholar]
- Grupe, D., Komossa, S., & Gallo, L. 2007, ApJ, 668, L111 [NASA ADS] [CrossRef] [Google Scholar]
- Grupe, D., Leighly, K. M., & Komossa, S. 2008, AJ, 136, 234 [Google Scholar]
- Grupe, D., Thomas, H.-C., & Leighly, K. 1999, A&A, 350, L31 [NASA ADS] [Google Scholar]
- Halpern, J., Gezari, S., & Komossa, S. 2004, ApJ, 604, 572 [NASA ADS] [CrossRef] [Google Scholar]
- Kalberla, P., Burton, W., Hartmann, D., et al. 2005, A&A, 440, 775 [NASA ADS] [CrossRef] [EDP Sciences] [Google Scholar]
- Karas, V., & Subr, L. 2007, A&A, 470, 11 [NASA ADS] [CrossRef] [EDP Sciences] [Google Scholar]
- Khokhlov, A., & Melia, F. 1996, ApJ, 457, L61 [NASA ADS] [CrossRef] [Google Scholar]
- Komossa, S. 2002, RvMA, 15, 27 [Google Scholar]
- Komossa, S., & Bade, N. 1999, A&A, 343, 775 [NASA ADS] [Google Scholar]
- Komossa, S., & Greiner, J. 1999, A&A, 349, L45 [NASA ADS] [Google Scholar]
- Komossa, S., & Merritt, D., 2008, ApJ, 683, L21 [NASA ADS] [CrossRef] [Google Scholar]
- Komossa, S., Halpern, J., Schartel, N., et al. 2004, ApJ, 603, L17 [NASA ADS] [CrossRef] [Google Scholar]
- Komossa, S., Zhou, H., Wang, T., et al. 2008, ApJ, 678, 13 [Google Scholar]
- Komossa, S., Zhou, H., Rau, A., et al. 2009, ApJ, 701, 105 [NASA ADS] [CrossRef] [Google Scholar]
- Lamastra, A., Bianchi, S., Matt, G., et al. 2009, A&A, 504, 73 [NASA ADS] [CrossRef] [EDP Sciences] [Google Scholar]
- Lamer, G., Uttley, P., & McHardy, I. M. 2003, MNRAS, 342, L41 [NASA ADS] [CrossRef] [Google Scholar]
- Lehto, H., & Valtonen, M. 1996, ApJ, 460, L207 [NASA ADS] [CrossRef] [Google Scholar]
- Leighly, K., Hamann, F., Casebeer, D., & Grupe, D. 2009, ApJ, 701, 176 [NASA ADS] [CrossRef] [Google Scholar]
- Lodato, G., King, A. R., & Pringle, J. E. 2009, MNRAS, 392, 332 [NASA ADS] [CrossRef] [Google Scholar]
- Magorrian, J., & Tremaine, S. 1999, MNRAS, 309, 447 [NASA ADS] [CrossRef] [Google Scholar]
- Marconi, A., & Hunt, L. 2003, ApJ, 589, L21 [NASA ADS] [CrossRef] [Google Scholar]
- McHardy, I., Koerding, E., Knigge, C., Uttley, P., & Fender, R. P. 2006, Nature, 444, 730 [NASA ADS] [CrossRef] [PubMed] [Google Scholar]
- Milosavljevic, M., Merritt, D., & Ho, L. 2006, ApJ, 652, 120 [NASA ADS] [CrossRef] [Google Scholar]
- Miniutti, G., Fabian, A., Brandt, W., Gallo, L., & Boller, Th. 2009, MNRAS, 396, 85 [Google Scholar]
- Nagao, T., Taniguchi, Y., & Murayama, T. 2000, AJ, 119, 2605 [NASA ADS] [CrossRef] [Google Scholar]
- Narayan, R., & Yi, I. 1994, ApJ, 428, L13 [NASA ADS] [CrossRef] [Google Scholar]
- Nicastro, F. 2000, ApJ, 530, L65 [NASA ADS] [CrossRef] [PubMed] [Google Scholar]
- Otani, C., Kii, T., & Miya, K. 1996, RFTU. proc, 491O [Google Scholar]
- Phinney, E. S. 1989, IAU Symp., 136, 543 [Google Scholar]
- Poole, T., Breeveld, A. A., Page, M. J., et al. 2008, MNRAS, 383, 627 [NASA ADS] [CrossRef] [Google Scholar]
- Read, A., Saxton, R., Torres, M., et al. 2008, A&A, 482, L1 [NASA ADS] [CrossRef] [EDP Sciences] [Google Scholar]
- Rees, M. J. 1988, Nature, 333, 523 [NASA ADS] [CrossRef] [Google Scholar]
- Risaliti, G., Elvis, M., Fabbiano, G., Baldi, A., & Zezas, A. 2005, ApJ, 623, L93 [NASA ADS] [CrossRef] [Google Scholar]
- Risaliti, G., Miniutti, G., Elvis, M., et al. 2009, ApJ, 696, 160 [NASA ADS] [CrossRef] [Google Scholar]
- Roming, P. W. A., Kennedy, T. E., Mason, K. O., et al. 2005, SSRv, 120, 95 [Google Scholar]
- Strubbe, L.E., & Quataert, E. 2009, MNRAS, 400, 2070 [NASA ADS] [CrossRef] [Google Scholar]
- Strubbe, L.E., & Quataert, E. 2011, MNRAS, 415, 168 [NASA ADS] [CrossRef] [Google Scholar]
- Saxton, R., Read, A., Esquej, P., et al. 2008, A&A, 480, 611 [NASA ADS] [CrossRef] [EDP Sciences] [Google Scholar]
- Saxton, R., Read, A., Esquej, P., Miniutti, G., & Alvarez, E. 2011, In Narrow-Line Seyfert 1 Galaxies and Their Place in the Universe, Proc. Sci., NLS1, 008 [Google Scholar]
- Shakura, N., & Sunyaev, R. 1973, A&A, 24, 337 [NASA ADS] [Google Scholar]
- Trump, J., Impey, C. D., Taniguchi, Y., et al. 2009, ApJ, 706, 797 [NASA ADS] [CrossRef] [Google Scholar]
- Ulmer, A. 1999, ApJ, 514, 180 [NASA ADS] [CrossRef] [Google Scholar]
- van Velzen, S., Farrar, G. R., Gezari, S., et al. 2011, ApJ, 741, 73 [NASA ADS] [CrossRef] [Google Scholar]
- Vaughan, S., Edelson, R., & Warwick, R. 2004, MNRAS, 349, L1 [NASA ADS] [CrossRef] [Google Scholar]
- Voges, W., Aschenbach, B., Boller, T., et al. 1999, A&A, 349, 389 [NASA ADS] [Google Scholar]
- Wang, J., & Merritt, D. 2004, ApJ, 600, 149 [NASA ADS] [CrossRef] [Google Scholar]
- Wang, T.-G., Zhou, H.-Y., Wang, L.-F., Lu, H.-L., & Xu, D. 2011, ApJ, 740, 85 [NASA ADS] [CrossRef] [Google Scholar]
- Yuan, W., Liu, B. F., Zhou, H., & Wang, T. 2010, ApJ, 723, 508 [NASA ADS] [CrossRef] [Google Scholar]
- Zauderer, B. A., Berger, E., Soderberg, A. M., et al. 2011, Nature, 476, 425 [NASA ADS] [CrossRef] [PubMed] [Google Scholar]
All Tables
All Figures
|
Fig. 1 An r-filter image of the galaxy from the SDSS survey, (limiting magnitude r ~ 23), taken on 2004-12-13, shown with the XMM-Newton slew error circle (8 arcsec radius) and UVOT-enhanced Swift error circle (2.1 arcsec radius; see text) centred on the detections. |
| In the text | |
|
Fig. 2 Calar Alto 3.5 m/TWIN spectrum of SDSS J1201+30 taken on 2010-06-22, 12 days after discovery, smoothed by a factor 4. ⊕ denotes the position of the Tellurium atmospheric absorption lines. |
| In the text | |
|
Fig. 3 WHT/ISIS spectrum of SDSS J1201+30 taken with the R316R, R300B grisms on 2011-05-11, 11 months after discovery, smoothed by a factor 4. ⊕ denotes the position of the Tellurium atmospheric absorption lines. |
| In the text | |
|
Fig. 4 The 0.2−2 keV X-ray light curve of SDSS J1201+30. XMM-Newton slew and pointed observations: circle, Swift-XRT: cross. All upper limits are from Swift except the RASS point. The latest upper limit point is calculated by combining the last three Swift observations from 2011-03-25, 2011-04-01 and 2011-04-11. The lines represent t−5/3 (solid) and t−5/9 (dotted) declines. |
| In the text | |
|
Fig. 5 The background-subtracted, exposure corrected, EPIC-pn (top), MOS-1 (middle) and MOS-2 (next to bottom) 0.16 − 1.0 keV light curves from the first XMM-Newton pointed observation of 2010-06-22, together with the exposure corrected, EPIC-pn background (bottom), which reaches a maximum of 0.022 count s-1. The MOS-1 curve is scaled by a factor 2.5 for ease of viewing. |
| In the text | |
|
Fig. 6 XMM-Newton, EPIC-pn spectra of SDSS J1201+30 from the slew survey (medium filter) and the three pointed observations (thin1 filter). |
| In the text | |
|
Fig. 7 A fit to the XMM-Newton EPIC-pn (black), MOS-1 (red / grey) and MOS-2 (green / light grey) spectra of SDSS J1201+30 from the 2010-06-22 observation with a rest-frame model of a Bremsstrahlung of kT = 390 eV and an edge at 660 eV. |
| In the text | |
|
Fig. 8 The 0.6−1.2 keV to 0.3−0.6 keV flux ratio as a function of the (absorbed) soft X-ray (0.2−2 keV) flux for observations with sufficient statistics to constrain the flux ratio. |
| In the text | |
|
Fig. 9 The spectral energy distribution of SDSS J1201+30, consisting of VLA 3-sigma upper limits, extinction corrected 2MASS and WHT data, UV data from the XMM-Newton OM (2010-06-22) and a power-law fit to the XMM-Newton X-ray data of 2010-06-22 (upper solid line) and 2010-12-23 (lower solid line). |
| In the text | |
|
Fig. 10 Limits on the bolometric luminosity of blackbody emission from SDSS J1201+30 during the observation of 2010-06-22. Filled squares represent limits from soft X-ray fits while filed circles give the limits from the UV emission. The cross-hatched area shows the allowable Lbol as a function of the rest frame blackbody temperature. |
| In the text | |
|
Fig. 11 The spectral slope of a single power-law, absorbed by the galactic column and intrinsic absorption, plotted against X-ray luminosity: SWIFT J164449.3+573451 (Burrows et al. 2011), SDSS J1201+30 and NGC 3599 (this work), NGC 5905 (Bade et al. 1996), RXJ 1242.6-1119 (Komossa & Greiner 1999; this fit only uses Galactic absorption), RXJ 1624+7554 (Grupe et al. 1999). |
| In the text | |
Current usage metrics show cumulative count of Article Views (full-text article views including HTML views, PDF and ePub downloads, according to the available data) and Abstracts Views on Vision4Press platform.
Data correspond to usage on the plateform after 2015. The current usage metrics is available 48-96 hours after online publication and is updated daily on week days.
Initial download of the metrics may take a while.