Fig. 9
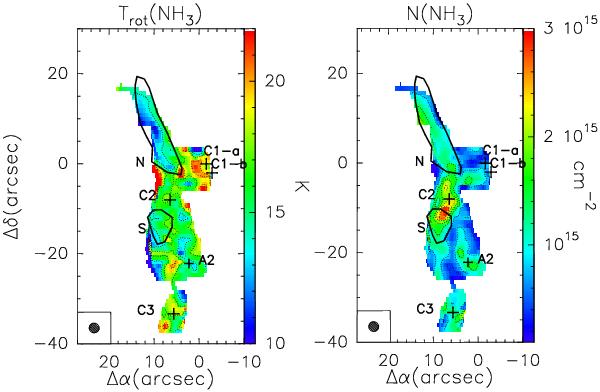
Map of rotation temperature (Trot, left panel) and NH3 total column density (N(NH3), right panel) derived from the NH3 (2, 2)-to-(1, 1) ratio as described in Sect. 3.3.1. In left panel, contour levels (dotted lines) range from 11 K to 20 K in steps of 3 K, while they range from 4 × 1014 cm-2 to 3.2 × 1015 cm-2 in steps of 4 × 1014 cm-2 in the right panel. Crosses and solid contours indicate the millimetre continuum cores and the N2D+ cores, respectively, as in Figs. 1 and 3. In both panels, the ellipse in the bottom left corner shows the VLA synthesised beam.
Current usage metrics show cumulative count of Article Views (full-text article views including HTML views, PDF and ePub downloads, according to the available data) and Abstracts Views on Vision4Press platform.
Data correspond to usage on the plateform after 2015. The current usage metrics is available 48-96 hours after online publication and is updated daily on week days.
Initial download of the metrics may take a while.